Faced with limited higher education options, rural students must travel farther, pay more, and borrow more, which limits graduates’ ability to return to their local communities where it is more difficult to pay off student loan debt.
This study, in conjunction with Priced Out: Black Students and Priced Out: Latinx Students, analyzes the intersection of college affordability and degree completion to uncover the extent to which affordability impacts students in pursuit of a degree. The reports provide insight into how disparities in access, cost, and ability to pay are creating unique barriers for Illinois students across the state and recommends policy actions to start reversing these trends.

Affordability Lens
Access, Cost, and Ability to Pay
There are many ways to look at affordability issues, which touch every step of the college-to-career pipeline. In the interest of clearly analyzing how affordability relates to policy, the reports in PCC’s Affordability Study separate these issues into the categories of Access, Cost, and Ability to Pay.
- Access issues are differences in college opportunities associated with students’ race, income, wealth, and/or place of birth
- Cost issues reflect the financial burden that students take on to enroll, persist, and complete college
- Ability to Pay disparities by race and income affect how students pay for these costs
Many topics in college affordability relate to a few or all of these categories, and accordingly these reports analyze affortability through these different lenses. For example, the high cost of private colleges can pose both an access issue, in that it can limit students’ ability to enroll and persist, and a cost issue, in how students attending these colleges must pay for their education.
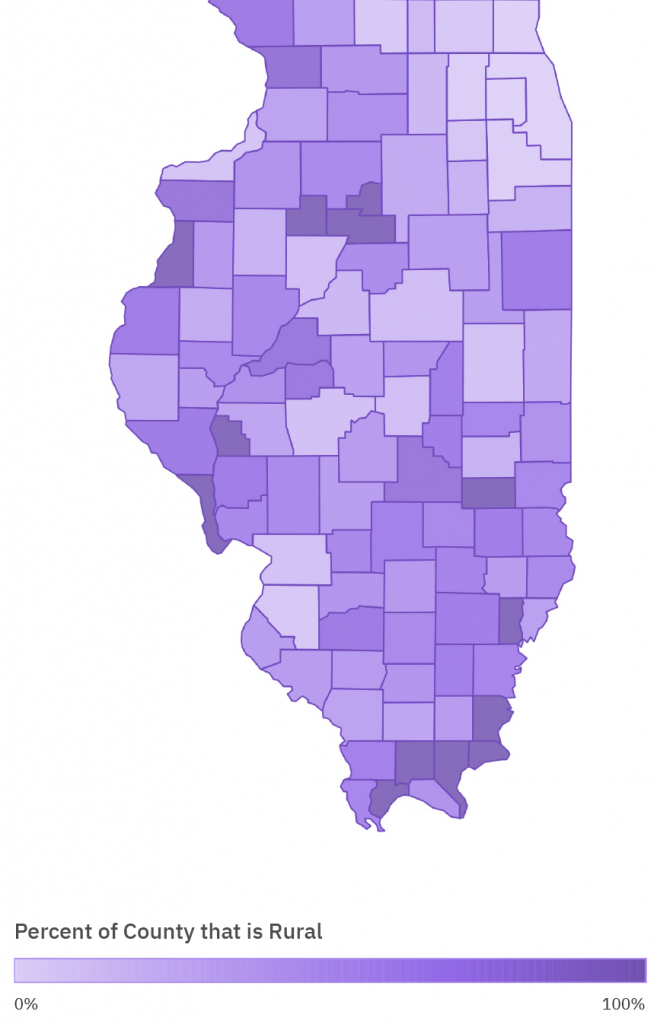
A Note on the Definition of Rural
This report seeks to outline the unique barriers for Illinois rural students pursuing college degrees. However, there are different definitions of rurality, each of which can add to the discussion of college affordability in the state. This report primarily examines how college-going factors differ depending on how densely populated a student’s county is (also defined as “rurality”). It further groups Illinois’ 102 counties into those that are mostly rural, those that are mostly urban, and the 13 counties that are 100% rural.[1] It is also instructive to look at Illinois’ colleges that serve areas that don’t have public alternatives that are both nearby and broadly accessible, referred to as “colleges with/without nearby public options.” This report uses the definitions of what constitutes a “broad access” institution and other nearby public options from Nicholas Hillman and Taylor Weichman’s 2016 study.[2] Finally, it utilizes survey data that groups students by rurality.
Part 1: Access
To thrive in the changing economy, residents from all areas of the state need accessible pathways to both associate and bachelor’s degrees. In Illinois, rural counties have significantly higher rates of associate degree attainment, but lower rates of bachelor’s degree attainment.[3] Further, within rural areas, the children of White households and higher income households are more likely to earn four-year degrees than their low-income and Black and Latinx peers.[4] It’s important to address these gaps in four-year degree attainment because having a bachelor’s degree is associated with greater employment rates and hundreds of thousands of dollars more in lifetime income for graduates. Increasing these rates also leads to faster economic growth for rural communities.[5]
There are myriad reasons behind the gaps between rural and urban four-year degree attainment. Distance is the most obvious and unavoidable barrier for rural Illinoisans, as in aggregate they must travel farther to get to public and private four-year colleges. Students cite distance as one of the most important factors in deciding which institution to attend, with some valuing it even more than price.[6] [7] Other factors include different college-going and career tendencies for those in rural areas.[8]This can be partly explained by different local economies in rural communities. However, recent trends underscore the need for bachelor’s degrees, as those sectors are employing fewer people, and the jobs remaining tend to require more education than they required in the past.[9]
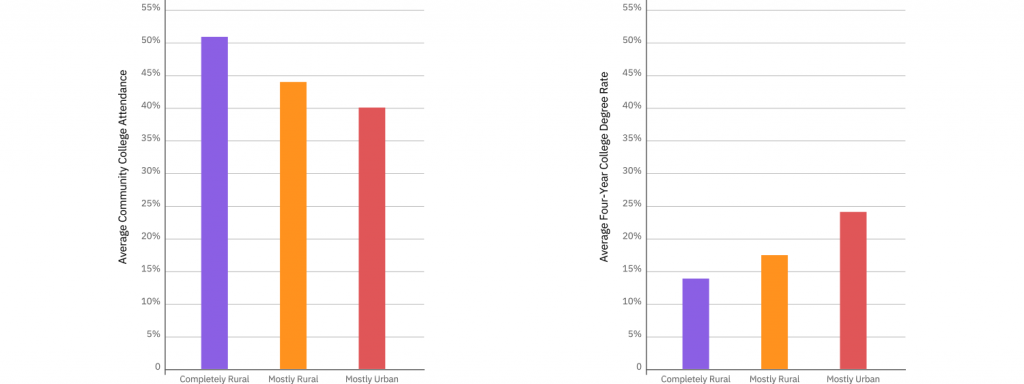
Rural students are more likely to enroll in community college and less likely to have four-year degrees
Opportunity in rural areas is especially stratified by a student’s race and income. Both rural and urban children who are born with below average income are less likely to earn a college degree than children of families with above average income.[10] However, low-income students in more rural areas are significantly less likely to file FAFSA forms in time to receive state aid, both reflecting and perpetuating college-going gaps between rural and urban Illinoisans.[11] Further, recent studies have shown that Black and Latinx students from rural areas face additional college-going barriers compared to White rural students.[12] Data estimating children’s future opportunity reflects this in Illinois, as being from a more rural area is correlated with a lower likelihood of college degree attainment for Latinx children.[13] For Black children there is no correlation, but the likelihood of attaining a college degree is consistently low across the state. A Black child has a one in five chance of attaining a college degree whether that child is raised in an urban or rural county
Though this study mostly focuses on challenges for students who do enroll in college, it’s important to acknowledge low four-year degree attainment for rural Illinoisans as a fundamental problem for the state, which is exacerbated by the affordability challenges discussed throughout this report. It is also an issue that requires immediate action, as the pipeline of potential students is shrinking every year. The number of high school seniors in mostly rural areas decreased by 6.4% from 2011 to 2016, compared to no change for mostly urban areas.[14]
For rural students, limited access to college can take the form of unequal representation across different college sectors. The sector of institution (i.e. two-year community college, four-year private nonprofit, etc.) is important to affordability, as each has different costs, likelihood of completing, and post-graduation payoffs. Illinois’ rural students enroll in public institutions, both community colleges and universities, at higher rates, and so they are more reliant on the state to provide affordable options. They are also more likely to attend for-profit institutions than their more urban peers, which have the highest costs of any sector and the worst debt repayment outcomes. [14a]
Rural Student Access by College Sector
Community colleges hold promise to provide students with local, affordable degrees, especially given many rural students’ lack of nearby access to four-year options. This is especially true for Illinois rural students, who attend community college at significantly higher rates than their urban peers.[15] However, this trend is driven by moderately rural to urban counties, indicating that in Illinois, access to colleges of all types is limited in the most rural districts. A rural student interviewed for this report, when asked why he decided against attending community college, said, “I would have to drive every day, 40 minutes one way just to go to the community college.” Students who do enroll in community colleges in Illinois’ most rural counties have complete at nearly a 50% rate, compared to about 26% for the most urban counties.[16] But, as this student points out, if commuting is not an option, community colleges become a less convenient and more costly proposition.
Community colleges can also provide lower-cost paths toward bachelor’s degrees, but students at more rural community colleges are significantly less likely to transfer to a bachelor’s degree-granting institution than their peers attending more urban community colleges. Only 18% of two-year public college students in the most rural counties transfer, compared to about a quarter of students in the most urban counties.[17] This is despite rural community colleges more closely resembling universities than non-rural community colleges in terms of full-time students. First-time, full-time students represent 69% of the student body of community colleges with few nearby public options, compared to 55% at colleges with other options nearby.[18] With bachelor’s degrees becoming increasingly important credentials, improving pathways from local colleges to public universities can facilitate more rural four-year degree attainment at lower costs, and ultimately a more in-demand workforce for rural communities.
Students can save money by earning credits and transferring to a public university, but this may not be the case when community college students transfer to other two-year institutions, to for-profit colleges, or “swirl” in between institutions of the same type. However, there are a few signs that rural students are transferring in ways that situate them well to earn an affordable bachelor’s degree. First, 55% of Illinois transfer students from community colleges with few nearby public options transfer to public universities, compared to just 35% at community colleges with public options nearby.[19] Further, at community colleges with few nearby options, only 2% of students transfer to for-profit colleges, compared to more than 6% at colleges with nearby public options.
Attending a public university can be geographically challenging for those outside of the Chicagoland area. Large parts of southeastern and northwestern Illinois are hours away from a university, and three universities are located in areas with few broad-access public options. The three universities in this category are more selective and enroll lower percentages of adult students and part-time students compared to Illinois’ other nine universities, and this is true comparing downstate universities to those in Chicago, as well.[20] These universities also have larger completion gaps between Black and White students and Pell-eligible and non-Pell-eligible students, compared to Illinois’ nine universities with other options nearby.
Though four-year universities throughout Illinois have faced serious enrollment declines in recent years, the three universities with few nearby options faced greater declines in enrolled students, applications, and the ability to yield students from applications compared to the nine universities with other public options nearby.[21] Enrollment declines can create other financial strains, leading to less tuition revenue and a perception of declining quality that can keep potential students from applying.
Distance is an important factor in any college decision, but especially at private nonprofit colleges, where the median student nationwide travels about 50 miles to get to college.[22] The median Illinois student from a rural area travels 40% farther to get to college, and over 100 miles to get to a private college, compared to 30 miles for urban and suburban students.[23] This may be in part due to geographical concentration; of the state’s 62 private colleges only 25 are outside Chicago’s metropolitan area, just 7 serve areas with limited public college options, and three-quarters of the state’s most selective private colleges are in the Chicago area.[24] Some of these selective colleges have recently acknowledged the need to better recruit rural students and are launching programs to help rural students learn about and attend these institutions.[25]
There are few private college options that report high completion rates for students of color outside of Chicago’s seven-county region. If a student wants to attend a private institution outside of the Chicago area where more than half of Black or Latinx students graduate, there are only six options, which average just 6% Black enrollment and 9% Latinx enrollment, and combine to graduate just 150 Black students and 260 Latinx students per year.[26] Thus, if the private nonprofit sector is to make a substantial impact in racial equity, it must provide access to more students of color from downstate Illinois.
Students who do not have access to affordable college options may consider online programs, and Illinois rural students are more likely to get their degree online than those from urban areas.[27] Surveyed Illinois students from more rural areas were also more likely to attend for-profit colleges than urban Illinoisans.[28] Though for-profit colleges often provide college access to students who are underserved by other sectors, the outsized costs of getting a degree from for-profit colleges and high default rates and loan amounts limit their ability to contribute to social mobility.[29] On average, Illinois’ for-profit colleges graduate just 31% of their students in 6 years.[30]

Policy Recommendations to Improve Access in Illinois Higher Education
- Convene an equitable funding formula work group
- Create a statewide direct admissions program
- Improve transfer pathways
For details on each recommendation, see the Improving Access section.
Part 2:Cost
Rural students pay a relatively greater price to attend college in Illinois than urban students. This is due in part to income gaps, and reflected in rural students borrowing more to attend four-year colleges and universities (see Ability to Pay). There are also financial challenges of living farther from colleges, such as traveling to or residing near campus, especially considering that universities with few nearby options cost more than those with nearby public options. The greater relative price and distance makes the thousands of dollars and hundreds of hours rural students spend in classrooms especially costly as compared to the wages they could be earning closer to home.
College graduates living in rural communities also earn less in income, as covered in the Payoffs section, and though these areas are more affordable to live in, that does not lower the cost of their degree or the amount of debt they have to pay back. Thus, many rural graduates face the choice of moving to areas with more earning potential or not attending college at all. Lowering college costs for rural students is paramount to reverse declining enrollment, giving students the option to return and boost rural economies, and for the state to achieve its goals of equity and college attainment.[31]
Perceptions of Affordability
Students’ perception of price affects access, as estimations of college costs can prevent students from applying or enrolling. Studies show that high sticker prices contribute to low-income students being especially susceptible to “undermatching,” or going to less selective colleges than they are qualified for, and that rural students are likely to undermatch.[32] The posted tuition and fees of Illinois’ 17 more selective colleges averages $34,195, compared to $14,681 at Illinois’ non-selective colleges.[33] One interviewed student related how these prices were discouraging: “The only time that prices really factored in was when I was considering [selective Chicago college].” This student started college in Iowa before transferring to, and ultimately graduating from, a different public university in Illinois. “I realized it’s the most expensive school in Illinois, and I said ‘never mind.’”
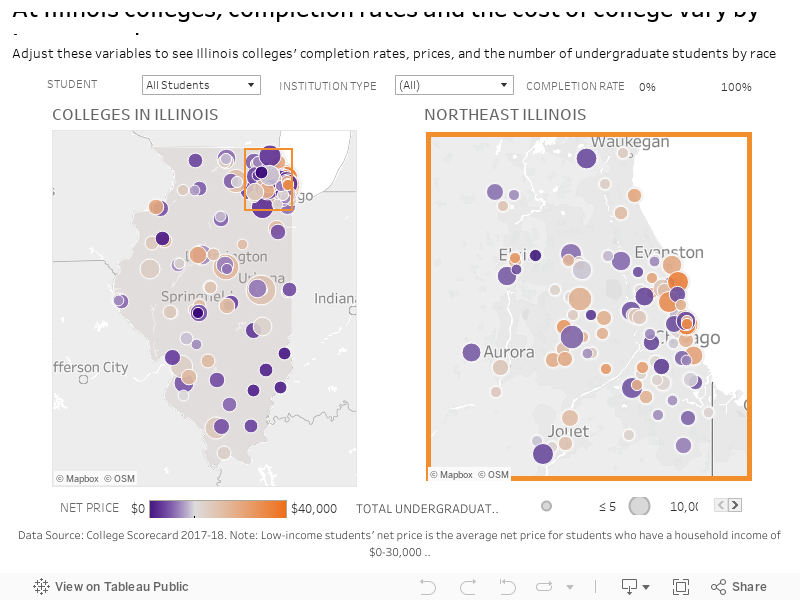
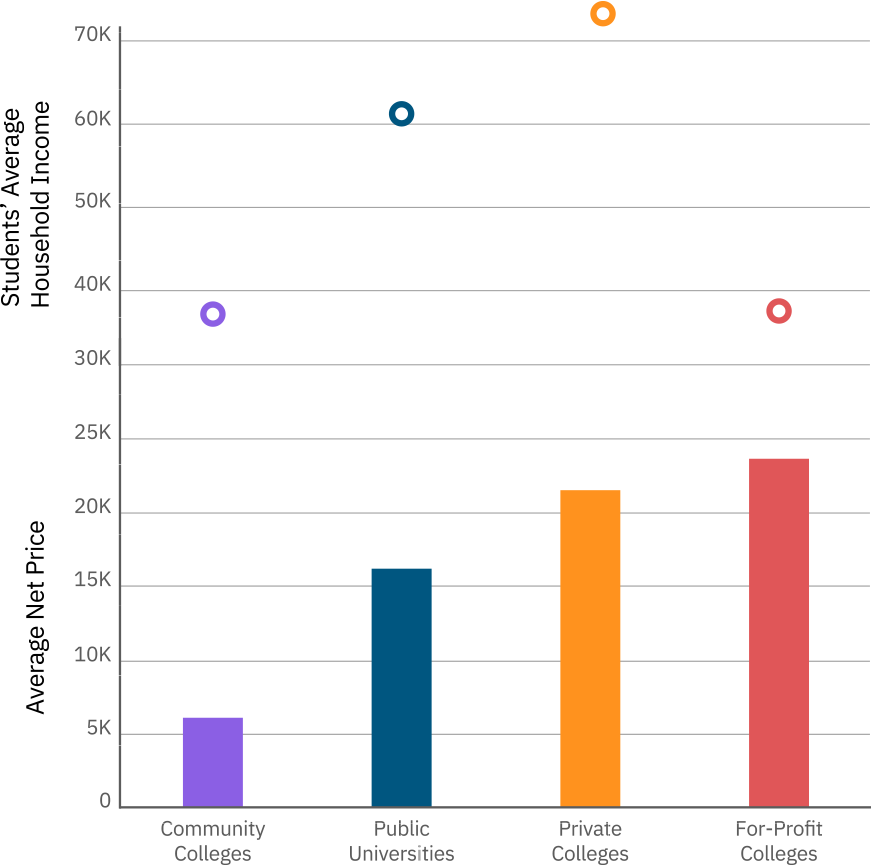
Average Net Price
The average cost of attendance, including tuition and fees, books and supplies, and on-campus or off-campus living expenses, minus the average grant/scholarship aid. This report looks at average net price overall, but also specifically for students with family incomes from $0 to $30,000, to see how affordable colleges are for low-income students.
The Price Students Pay by College Sector
Community colleges can put degrees within reach for students, as these colleges are well-priced relative to four-year institutions. On average, students pay a net price of $6,200 to attend community college in Illinois, $10,000 less per year compared to public universities.[34] Though improving transfer pathways could increase the potential value students receive, community colleges are integral to Illinois keeping college affordable and accessible, particularly for rural students.
At all income levels, Illinois’ public universities are among the most expensive in the country in terms of net price. The three Illinois universities with few nearby public options end up costing students $17,300 on average per year, $1,300 more than the average of the Illinois universities with public options nearby. Being from a more rural area makes a student significantly more likely to be in the lowest income bracket, and the cost of Illinois public universities for students in the lowest income bracket is $12,800, among the highest in the nation.[35] With net price for lowest-income students being 50% higher than the average of the midwest, nearby states may be a particularly attractive option for rural students, especially those who have to travel far distances to attend Illinois universities.
Though private nonprofit colleges often cite affordable overall costs for low-income students after accounting for institutional aid, actual costs of private colleges tend to be far greater than public institutions; students whose families make less than $30,000 pay about $17,500 at private four-year colleges.[36] The institutions that serve more rural students, both downstate and in areas without nearby public options, are on average a few thousand dollars less expensive. However, this doesn’t account for costs associated with the additional distance between students and their hometowns. As one interviewed student said, “I really thought about prices when I finished community college. I applied to [public university], and I applied to [small private college], which are very different. [Private university is] really expensive. There was a big difference but once I looked at the sticker price, and I didn’t even look at the aid I would get, I knew I clearly wasn’t going to go there.” Perceptions of affordability were clearly a factor for this student, as the private university she was considering lists a $35,000 price for tuition and fees, compared to $14,000 in tuition and fees for in-state students at the public university. How much she would actually pay depends on her family income, but for the lowest-income students, the public university she ended up attending would still be 20% less costly than the private college she was considering.
Considering the cost of uprooting and moving toward opportunity, distance education is a convenient route toward a degree for rural students, which is increasingly being offered by both public universities and for-profit colleges.[37] However, a recent survey found that online students face equal or higher tuition costs at public universities and private nonprofit colleges, compared to those attending on-campus at these institutions, which some have termed a “rural tax.”[38] Among for-profit college students in Illinois, rural students are much more likely to be earning their degree entirely online. Though for-profit institutions specialize in providing access to students who otherwise may not have it, especially rural students, they are more expensive than any other sector, at a net price of $22,000 for the lowest-income students. Further, there is mounting evidence that this sector produces subpar outcomes at high costs.[39] Illinois’ for-profit colleges average 23% of their students defaulting on student loans within four years of taking them out, with an average of $15,000 in debt.[40] Both students’ default rates and amounts are higher than in any other sector.
Opportunity Cost
College is often spoken of as an investment. However, unlike putting savings in the stock market, the decision to spend one’s time attending college comes at the direct expense of making money, unless a student has wealth or the ability to take on debt with little consequence. Opportunity cost is especially high for Illinois’ rural students. Though they stand to gain lifetime income by graduating from college, doing so often means leaving financially secure situations, as residing in a rural Illinois county is associated with having greater assets and more affordable housing.[41] Moving also has many harder-to-define costs, both financial and social, and of nationally surveyed adults, those from rural areas least prefer to move away from their community type.[42]
Lowering college costs has the potential to stem rural “brain drain” by better allowing rural students to venture off to college without risking their financial stability. As an interviewed rural student said, “I think most graduates, especially if they have student debt, are going to go where the jobs are, the places that make them the money to pay off their debts. If you want a job that’s not available around [rural areas], you’re naturally going to move… but I think that more people would be willing to stay around if they could afford college without taking out student loans.” Lowering these opportunity costs could also spur more rural students to pursue four-year degrees in the first place, increasing the rural student pipeline, and with it the potential to stimulate rural economies.[43]
Students with lower income disproportionally attend community colleges and for-profit colleges
Policy Recommendations to Decrease the Cost of a Degree
- More equitably fund colleges and universities
- Eliminate MAP at for-profit colleges
- Create completion and re-engagement grants
For details on each recommendation, see the Decreasing the Cost of a Degree section.
Part 3: Ability to Pay
Costs are only half of the equation of how affordable college is, as they are relative to a student’s ability to pay. This is a complex picture for rural residents of Illinois, who have less income on average, but also generally experience lower poverty levels and have more assets than their urban peers. Combined with the increasing cost of college, these factors make it harder to leave rural areas for higher education. In Illinois, there is evidence of lower-income rural students tending to attend community college, whereas higher-income rural students attend public and private four-year colleges that average greater lifetime income for graduates. Nonetheless, these students still take out amounts of debt that can ultimately make it harder to return to rural communities.
Percent Rurality by County
Income by County
Income and Wealth
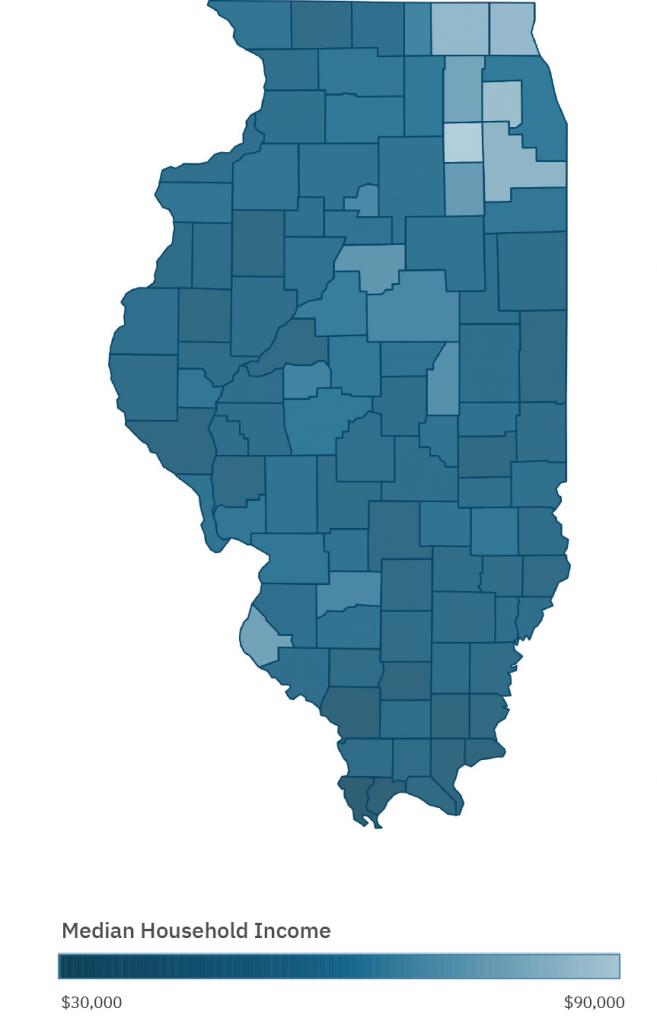
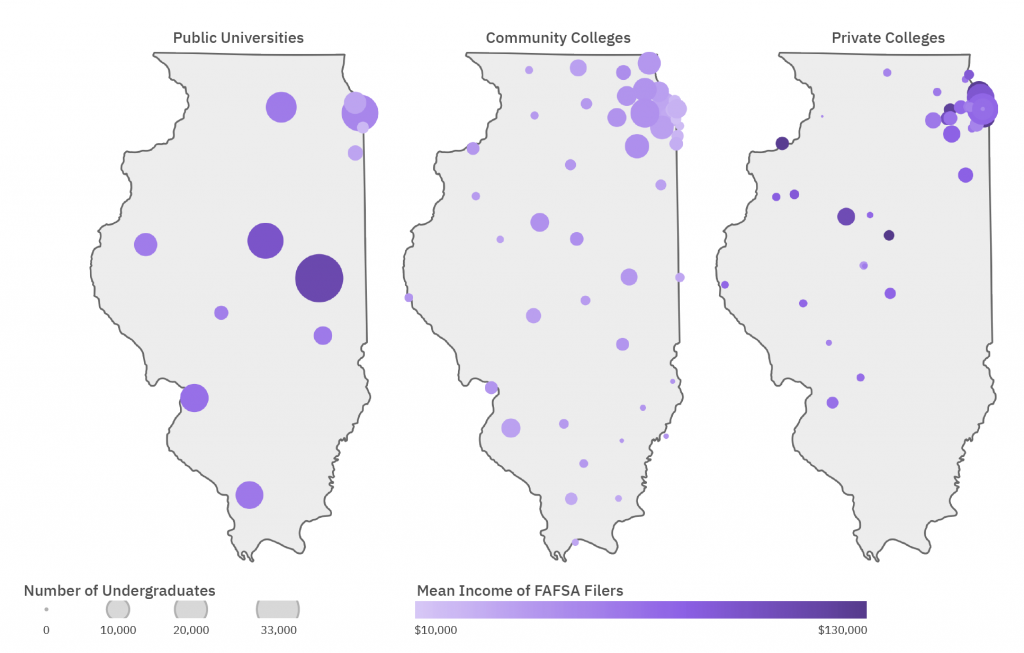
Discussions of college affordability typically start with household income as a measurement of a family’s ability to pay. In Illinois, the median household in mostly urban counties has $55,800 in income, compared to $50,700 for households in mostly rural counties. These gaps significantly increase the more rural an area is, with residents of completely rural areas averaging $48,200 in annual income.[44] However, these gaps are not reflected in the income of rural students attending four-year colleges and universities. Among Illinois college students, those from rural areas report greater parental income and pay about the same percentage of their income to attend college, relative to urban students.[45] Furthermore, the mean income of FAFSA-filing public university students enrolled in colleges with no nearby public options is $20,000 greater than students at the nine universities with other options nearby. The same is true of private nonprofit colleges with no nearby public options, as students’ household income at these colleges is $9,500 more than private colleges with public colleges in the area. The discrepancy between rural households averaging less income than urban households, but the opposite being true of rural four-year college students, could reflect higher-income rural students disproportionately attending four-year colleges. Similarly, rural community colleges tend to enroll lower-income students. This is evident comparing FAFSA-filing students at community colleges with few public options nearby, who average $40,100 in household income, as opposed to students at universities with few public options nearby, who have a household income of $76,500.[46]
FAFSA-Filing students at public universities and private colleges have greater household incomes
Though rural residents as a whole have less income, other wealth indicators show those living in rural counties may still be in more stable financial positions than urban Illinoisans. Being in a more rural county is significantly correlated with wealth indicators such as being less likely to live in asset poverty or have zero net worth, and more likely to use a bank account and own a home.[47] The relative wealth rural residents have is itself an opportunity cost, as potential students can better maintain their financial assets by staying local and earning short-term degrees or none at all, even if it means sacrificing potential wealth for future generations.
Taking on and Paying off Debt
Illinois rural community college students tend to have positive debt outcomes compared to more urban students. Students attending two-year colleges in mostly rural areas are less likely to take out loans and more likely to repay them.[48] Further, students attending community colleges without other public options nearby took out less debt and repaid it within three years at a slightly higher rate than students attending colleges with other public options nearby.[49]
On the contrary, rural students attending public universities take out more debt to afford their degrees relative to urban students. Surveyed public four-year university students from more rural areas in Illinois owe $10,500 in debt, compared to $9,200 for those from cities and suburbs. Both the rural-urban gaps in the likelihood of borrowing and the amounts students borrow are larger for private four-year universities.[50] Looking at rural institutions tells a similar story, as students at universities with few public alternatives nearby are slightly more likely to take out loans and have greater amounts of debt.[51] “When I first looked at [public university], I saw my student loan bill, not including financial aid, was going to be about $36,000,” said a rural community college student interviewed for this report. “If I was going to take that much out, I would go somewhere else for that loan money. I’d pay the $100,000 and go to [out of state university], where it’s $50,000 per year for an out-of-state student.”
The concern is not necessarily the amount of debt that rural students are taking on, as borrowing can allow students to access and persist in expensive institutions that pay off in the long-term. To that point, students in universities with no nearby public options pay off loans at a higher rate.[52] The issue is that, according to national research, only one half of rural students who take out loans end up staying in rural areas, compared to two-thirds of students who don’t take out debt.[53] The amount is significant too, as 73% of rural students with the greatest loan amounts move to cities, compared to just 37% of those with the least loan amounts.[54]
Decreasing state appropriations leads to students paying more and taking out more debt.[55] Further, reinvestment that lowers costs and debt burdens have great economic potential for rural areas. Studies show that many people born in rural areas have the desire to return and settle down in these communities, that they will increasingly return if they are financially incentivized to do so, and that this return can boost rural economies.[56]
State and Federal Aid
Federal and state aid are meant to make up most of the difference between a college’s cost and what a family can afford to pay. However, state aid has become less reliable and lost purchasing power. After nearly two decades of disinvestment, the state’s Monetary Award Program (MAP) has turned into a first-come, first-served grant. In Fiscal Year 2018, MAP was not able to provide awards to nearly 100,000 qualified students. For those that did receive funding, it only covered about one-third of tuition and fees at four-year colleges and universities.[57] These funding shortages are disproportionately affecting students from rural areas, as there is a significant correlation between an area being more rural and having a greater percentage of eligible students who do not receive MAP grants because of funding shortages.[58] Rural students’ disproportionate enrollment in community college also makes aid shortages more impactful. By design, first-come, first-served MAP grants unduly affect students at community colleges who are four times more likely than students from public universities to be denied funding, despite being eligible and applying.[59]
Worse, in Fiscal Year 2016 and Fiscal Year 2017, the State of Illinois operated without a budget, turning the persistent issue of state aid shortages into a dire situation, as colleges couldn’t guarantee these funds to students. Notably, many colleges and universities guaranteed this funding to students during the impasse. However, in an ISAC survey during one of the delays in MAP funding, about half of respondents said that this funding uncertainty affected their educational goals, hundreds reported dropping out of school because of it, and about half said that they increased working hours and/or decreased credits taken to make up for this funding loss.[60] One student interviewed for this report expressed the uncertainty and cuts that came with the budget crisis: “Actually [the budget crisis] was a huge thing at [public university]. There was a 200-employee layoff during it, and there were rumors like, ‘the college is going to close. We might not come back next year.’ We were all freaking out, wondering, ‘is our degree going to mean anything?’ I was going to have to go live back home.” This student was able to weather this storm, and did not have his aid affected, but that’s not always the case. Sudden changes in costs can cause students to discontinue their education, and unfortunately MAP shortcomings make this an annual risk for tens of thousands of rural students in Illinois.[61]
Policy Recommendations to Increase Students’ Ability to Pay
- Increase state investment in the Monetary Award Program
- Eliminate or reform merit-based aid
For details on each recommendation, see the Increasing Students’ Ability to Pay section.

Payoffs of a Degree
Earning a college degree is often assumed to have certain universal economic payoffs for the graduate, such as steady employment, a lifetime pass into middle class earnings, and a comfortable level of wealth for future generations. For rural students, capitalizing on their education often means moving to more urban areas. As one rural student said, “I love [my hometown] but people in my field say, ‘you’re not going to find a lot of money here, you’re not going to have a lot of opportunity necessarily.’”
Nationwide trends show that rural areas, especially in the Midwest, are experiencing population declines and economic stagnation relative to cities.[62] In Illinois, the financial motivation for leaving rural areas may be apparent in data on opportunities. While many factors affect the likelihood of being in the top income quintile, there is a significant negative relationship between staying in more rural counties and the amount of income an Illinoisan is predicted to make.[63]
In rural areas, the future also looks different depending on a person’s education. A national survey showed those from rural areas with some college or less are 23% less likely than their urban counterparts to feel optimistic about their financial futures, but there was no difference among those who had four-year degrees.[64]
The payoff of a college education is different for a graduate living in a rural area than for a suburban or urban student, and these are important factors when graduates decide where to live after college.[65] In a national study on student loan debt, the Federal Reserve found that rural students who moved to urban areas made nearly $10,000 more per year and paid off their student loans at greater rates than those who stayed in rural communities.[66] The value of a degree is further stratified by race, as more than any subgroup surveyed, nonwhites from rural areas report that the availability of jobs is a major problem.[67]
In Illinois, depopulation of potential college-going students is disproportionately happening in rural areas, as evidenced by previously mentioned declines in 12th grade students. These declines are also correlated to a higher percentage of households at the lowest income level.[68] Equitable access to higher education is crucial for these communities and their residents to connect to the changing economy, and in doing so avoid increasing poverty in the most rural areas.
Conclusion
Rural Illinois college students face unique barriers to access college compared to their more urban peers such as additional costs and a lower ability to pay, at least in terms of income. The payoffs of a degree for the state’s non-metropolitan population are often dependent on whether they are willing to move to cities, a decision that can be costly and damaging for their home communities.
The most immediate policy path to addressing these barriers is to connect rural students to opportunity, especially in enrolling in and transferring to public universities. These must be accompanied by improving graduation outcomes at the colleges and universities serving these students, especially focusing on rural students of color, who currently face greater challenges and larger gaps to degree completion than the rest of the state.
The reality is that state policy may not be able to reverse macroeconomic trends of urbanization or the increasing cost of a degree. However, it can help rural communities adapt while lowering the net price of a degree, ultimately getting more rural students through college and thriving in less urban areas of Illinois. Recommendations that make degrees more affordable for students, and thus less likely to leave their communities, tend to be simple, if difficult, to achieve. More resources are crucial for change. Reinvesting in colleges will increase their capacity to serve rural students. And increasing MAP coverage and award amounts can get more low-income rural students to and through college.
References
1. Bureau, US Census. “2010 Census Urban and Rural Classification and Urban Area Criteria.” Accessed August 8, 2019. This report mostly uses data at the county level, as it is the most local level that is comparable between education and census datasets.
2. Hillman, Nicholas, and Taylor Weichman. “Education Deserts: The Continued Significance of ‘Place’ in the Twenty-First Century.” Viewpoints: Voices from the Field. American Council on Education, 2016. “Broad-access institutions” are public colleges or universities that admit at least 75% of applicants. Colleges that serve areas with no nearby options are ones located within a commuting zone that has at most one broad-access institution within it.
3. Analysis of U.S. Census Bureau, “2010 Census Urban and Rural Classification and Urban Area Criteria.” and U.S. Census Bureau. “American FactFinder.” Accessed May 24, 2019.
4. “Data Library.” Opportunity Insights (blog). Accessed May 30, 2019.
5. Florida, Richard. “The Talent Dividend in Urban and Rural Areas.” CityLab. Accessed September 29, 2019. and Hertz, Thomas, Lorin Kusmin, Alexander Marré, and Timothy Parker. “Rural Employment Trends in Recession and Recovery.” United States Department of Agriculture Economic Research Service, August 2014. and Scott, Shanda Carter, Michael Thomas Miller, and Adam Morris. “Rural Community College Student Perceptions of Barriers to College Enrollment.,” 2016.
6. Bureau, U. S. Census. “American FactFinder.” Accessed May 24, 2019. and “Report Card Data Library.” Illinois State Board of Education. Accessed May 28, 2019.
7. Ruiz and Perna, “The Geography of College Attainment: Dismantling Rural ‘Disadvantage.’”
8. Corbett, Mike. “Rural Futures: Development, Aspirations, Mobilities, Place, and Education.” Peabody Journal of Education 91 (February 24, 2016): 00–00.
9. Cooke, Thomas J., and Paul Boyle. “The Migration of High School Graduates to College.” Educational Evaluation and Policy Analysis 33, no. 2 (June 1, 2011): 202–13.
10. Bureau, U. S. Census. “American FactFinder.” Accessed May 24, 2019. and “Report Card Data Library.” Illinois State Board of Education. Accessed May 28, 2019. Note: There is no similar relationship between taking advanced courses, indicating that college preparedness may not be as accessible and/or high of a priority in these areas.
11. “Data Library.” Opportunity Insights (blog). Accessed May 30, 2019.
12. Irvin, Matthew J., Soo-yong Byun, Judith L. Meece, Thomas W. Farmer, and Bryan C. Hutchins. “Educational Barriers of Rural Youth: Relation of Individual and Contextual Difference Variables.” Journal of Career Assessment 20, no. 1 (October 10, 2011): 71–87.
13. Chetty et al., “Race and Economic Opportunity in the United States An Intergenerational Perspective.”
14. “National Postsecondary Student Aid Study: 2008 Undergraduates.” National Center for Education Statistics. Accessed July 31, 2019.
15. “Report Card Data Library.” and Bureau, “American FactFinder.”
16. U.S. Department of Education. “College Scorecard Data.” College Scorecard, May 21, 2019. [Tableau AE]
17. Ibid. A higher percentage of urban two-year Illinois students go in with the intention of transferring, but these gaps aren’t large; 32% of rural community college students are enrolled in order to transfer, compared to 36% of urban students. “NCES PowerStats.”
18. U.S. Department of Education, “College Scorecard Data.”
19. Illinois Board of Higher Education. “Transfer Enrollment: Undergraduate Transfers Data Tables.” Illinois Board of Higher Education. Accessed October 1, 2019. There is also a statistically significant correlation between a community college being in a more rural area and a higher percentage of transfers going to public university, as well as a negative correlation with going to for-profit colleges.
20. Ibid.
21. Illinois Board of Higher Education. “Table I-2: Total Fall Enrollments by Gender, Race or National Origin, and Type of Institution, and Level of Instruction Fall 2017.” Illinois Board of Higher Education. Accessed July 31, 2019. and “Admitted Freshmen At Illinois Public Universities: Who Enrolls Where?” Illinois Board of Higher Education. Accessed August 8, 2019.
22. Hillman and Weichman, “Education Deserts: The Continued Significance of ‘Place’ in the Twenty-First Century.”
23. “NCES PowerStats.” NPSAS 08
24. “The Integrated Postsecondary Education Data System.” IPEDS: Use The Data. Accessed May 24, 2019.
25. Rhodes, Dawn. “Illinois Colleges Ramp up Pursuit of Rural Students: ‘Colleges Need to Understand More about Rural Areas — They Are Kind of in a Bubble.’” chicagotribune.com. Accessed September 26, 2019.
26. Augustana, Knox, Bradley, Illinois College, and Illinois Wesleyan. Bassett, Meegan Dugan. “Getting to the Goal: Increasing Bachelor’s Degrees Among Black and Latino Students in Illinois.” Dugan Bassett Consulting, December 2018.
27. “NCES PowerStats.” NPSAS 08
28. Ibid.
29. Deming, David J., Claudia Goldin, and Lawrence F. Katz. “The For-Profit Postsecondary School Sector: Nimble Critters or Agile Predators?” Journal of Economic Perspectives 26, no. 1 (February 2012): 139–64.
30. U.S. Department of Education, “College Scorecard Data.”
31. Illinois 60×25 initiative is a legislative priority with the goal of having 60% of the state’s adults having a high-quality degree or credential by the year 2025.
32. Smith, Jonathan, Matea Pender, and Jessica Howell. “The Full Extent of Student-College Academic Undermatch.” Economics of Education Review 32 (February 1, 2013): 247–61. And Hoxby, Caroline M., and Christopher Avery. “The Missing ‘One-Offs’: The Hidden Supply of High-Achieving, Low-Income Students.” Brookings Papers on Economic Activity (blog), March 21, 2013.
33. U.S. Department of Education, “College Scorecard Data.”
34. Ibid.
35. Ibid.
36. Ibid.
37. Mattes, Margaret. “The Private Side of Public Higher Education.” The Century Foundation, August 7, 2017.
38. Poulin, Russell, and Terri Taylor Straut. “Distance Education Price and Cost Report.” WICHE Cooperative for Educational Technologies (WCET), February 2017. and McKenzie, Lindsay. “An Online Tax for Rural Students.” Inside Higher Ed, January 30, 2019.
39. “NCES PowerStats.” NPSAS 08
40. “The Integrated Postsecondary Education Data System.”
41. “Prosperity Now Scorecard Data By Location.” Prosperity Now. Accessed May 28, 2019. and Bureau, “American FactFinder.”
42. Parker, Kim, Juliana Menasce Horowitz, Anna Brown, Richard Fry, D’Vera Cohn, and Ruth Igielnik. “What Unites and Divides Urban, Suburban and Rural Communities.” Pew Research Center (blog), May 22, 2018. https://www.pewsocialtrends.org/2018/05/22/what-unites-and-divides-urban-suburban-and-rural-communities/
43. Deming, David, and Susan Dynarski. “College Aid.” In Targeting Investments in Children: Fighting Poverty When Resources Are Limited, 283–302. National Bureau of Economic Research, Inc, 2010. https://www.nber.org/chapters/c11730.pdf
44. U.S. Census Bureau. “American FactFinder.” Accessed May 24, 2019.
45. “NCES PowerStats.” NPSAS 08
46. “Table 2.3d of the 2018 ISAC Data Book.” Illinois Student Assistance Commission, n.d.
47. “Prosperity Now Scorecard Data By Location.” and U.S. Census Bureau, “2010 Census Urban and Rural Classification and Urban Area Criteria.”
48. U.S. Department of Education, “College Scorecard Data.”
49. Hillman, Nicholas. “William & Mary Mobility Conference.” Tableau Public, April 30, 2017.
50. “NCES PowerStats.” NPSAS 08
51. Hillman, Nicholas. “William & Mary Mobility Conference.” Tableau Public, April 30, 2017.
52. U.S. Department of Education, “College Scorecard Data.”
53. Tabit, PJ, and Josh Winters. “‘Rural Brain Drain’: Examining Millennial Migration Patterns and Student Loan Debt.” Consumer & Community Context. The Federal Reserve, January 2019. Illinois rural students are more likely to expect help in repaying student loans relative to urban students, especially at private non-profit colleges.
54. Ibid.
55. Boston, Federal Reserve Bank of. “Consequences of State Disinvestment in Public Higher Education: Lessons for the New England States.” Federal Reserve Bank of Boston, February 21, 2019.
56. “Rural America Is Losing Young People – Consequences and Solutions.” Wharton Public Policy Initative. Accessed October 5, 2019.
57. “Basic ISAC Program Data.” Illinois Student Assistance Commission, December 2018.
58. U.S. Census Bureau, “American Factfinder.” and data provided by the Illinois Community College Board (ICCB) Note: This analysis was done by house district, as this was the geographic level provided by ICCB
59. “Monetary Award Program Historical Awards and Payout Summary FY2009-FY2018.” 2018 ISAC Data Book. Illinois Student Assistance Commission, n.d.
60. “FY17 MAP Grant Survey: What Is the Impact on Students?”
61. Conger, Dylan, and Lesley J. Turner. “The Effect of Price Shocks on Undocumented Students’ College Attainment and Completion.” Journal of Public Economics 148 (April 1, 2017): 92–114.
62. Parker, Kim, Juliana Menasce Horowitz, Anna Brown, Richard Fry, D’Vera Cohn, and Ruth Igielnik. “Demographic and Economic Trends in Urban, Suburban and Rural Communities.” Pew Research Center, May 22, 2018.
63. “Data Library.” Opportunity Insights (blog). Accessed May 30, 2019.
64. Parker et al., “What Unites and Divides Urban, Suburban and Rural Communities.”
65. Fiore, Ann Marie, Linda S. Niehm, Jessica L. Hurst, Jihyeong Son, Amrut Sadachar, Daniel W. Russell, David Swenson, and Christopher Seeger. “Will They Stay or Will They Go? Community Features Important in Migration Decisions of Recent University Graduates.” Economic Development Quarterly 29, no. 1 (February 1, 2015): 23–37.
66. Tabit and Winters, “‘Rural Brain Drain’: Examining Millennial Migration Patterns and Student Loan Debt.”
67. Parker et al., “Demographic and Economic Trends in Urban, Suburban and Rural Communities.”
68. “Report Card Data Library.” Illinois State Board of Education. Accessed May 28, 2019. and “Data | Opportunity Insights.” Accessed May 30, 2019.