
On Illinois’ Disinvestment In Higher Education & What Can Be Done About It
This study, in conjunction with Priced Out: Black Students and Priced Out: Rural Students, analyzes the intersection of college affordability and degree completion to uncover the extent to which affordability impacts students in pursuit of a degree. The reports provide insight into how disparities in access, cost, and ability to pay are creating unique barriers for Illinois students across the state and recommends policy actions to start reversing these trends.

Affordability Lens
Access, Cost, and Ability to Pay
There are many ways to look at affordability issues, which touch every step of the college-to-career pipeline. In the interest of clearly analyzing how affordability relates to policy, the reports in PCC’s Affordability Study separate these issues into the categories of Access, Cost, and Ability to Pay.
- Access issues are differences in college opportunities associated with students’ race and/or place of birth
- Cost issues reflect the financial burden that students take on to enroll, persist, and complete college
- Ability to Pay disparities by race and income affect how students pay for these costs
Many topics in college affordability relate to a few or all of these categories, and accordingly these reports analyze them through these different lenses. For example, high cost private colleges can pose both an access issue, in that it can limit students’ ability to enroll and persist, and a cost issue, in how students attending these colleges must pay for their education.
Part 1: Access
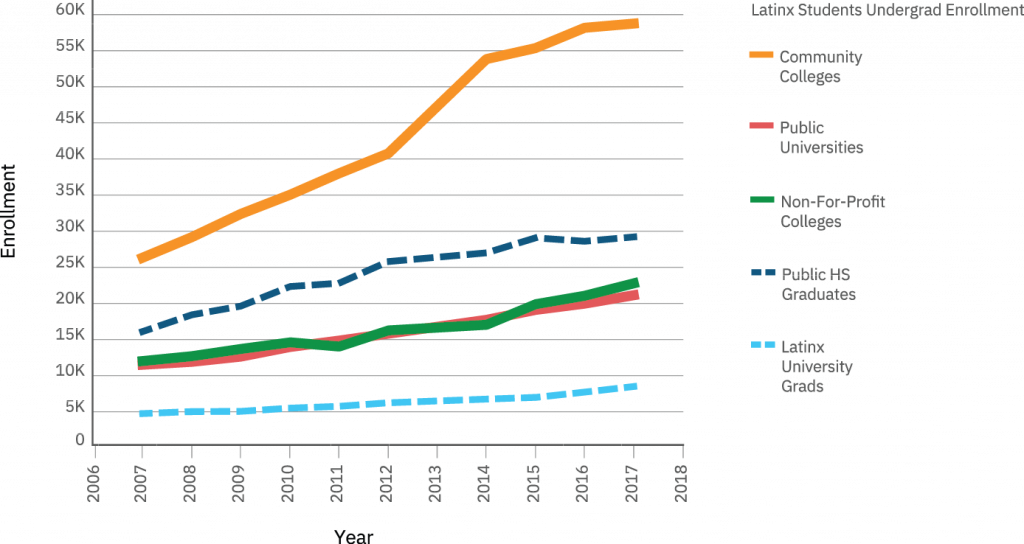
Latinx student access to higher education has been shaped by both Illinois’ population changes and the state’s increasingly unaffordable higher education system. There has been progress in college access for Latinx students, as 20,300 more Latinx students attended a four-year college and 32,400 more attended a two-year college in 2017 compared to 2007.[1] Community colleges drove college enrollment increases, more than doubling the enrollment of Latinx Illinoisans over this time period, and four-year private colleges growth slightly outpaced the rate of growth for high school graduates. At public universities, Latinx student enrollment increased at about the same rate as high school graduates.[2] However, in part because of low transfer and completion rates, the number of Latinx high school graduates grew 39% faster than four-year degree increases over a comparable period.[3] These trends reflect a theme that resonates throughout this report: more Latinx students may be enrolling overall, but bachelor’s degrees, which on average offer the greatest financial payoffs, are less accessible for Latinx students than they were 10 years ago.
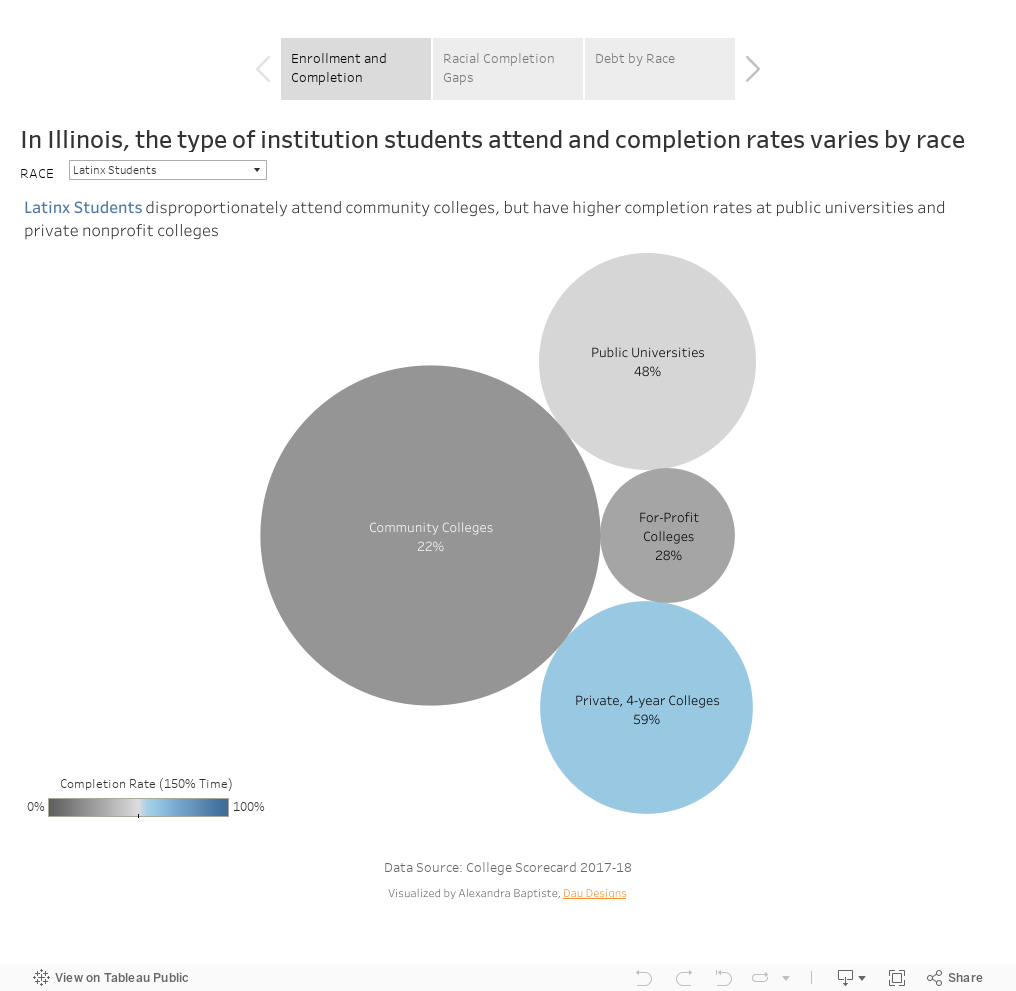
For Latinx students, decreased access often takes the form of unequal representation within different college sectors (i.e. two-year community college, four-year private nonprofit, etc.). Looking at which institutions enroll greater populations of Latinx students shows differential access by race, as public and private colleges with higher completion rates, transfer rates, and post-graduation incomes tend to enroll lower percentages of Latinx students. The public universities that enroll lower percentages of Latinx students are also receiving the bulk of state appropriations, leaving institutions serving the largest percentages of Latinx students less resources to adequately support them. Taxpayers fund public universities to provide college access for Illinois students, and therefore these institutions should at least serve a percentage of Latinx students representative of the state’s population. Moreover, universities enrolling at least a representative percentage of Latinx students must have greater resources to do so, as they are working to counteract large racial wealth disparities that can affect completion, covered in the Ability to Pay section of this report.
Finally, there are completion gaps between Latinx and White students at nearly all colleges and universities, showing that Latinx students experience barriers within a college. This report also focuses on developmental education, which segments students into non-college-level courses that are often the first and last stop for students in college. The way Latinx students are being over-placed and under-served in developmental education makes it both a civil rights and an affordability issue, as Latinx students are not being provided the same opportunity of earning a degree.
Latinx enrollment in high school and college have outpaced degrees earned
Latinx Representative and Non-Representative Institutions
This report outlines how Latinx students are not gaining access to certain public and private colleges at the same rates as White students. One way of measuring and discussing this is through representation: representative institutions are those that enroll 19% or more Latinx students, reflecting the population of 18-24 year-old Illinoisans, and non-representative institutions fall short of that. This is illustrative for public universities, which should reflect the diversity of the state that funds them, and private colleges, in seeing what populations they are serving.
Latinx Student Access by College Sector
By offering a lower-cost education, as well as orienting practices and policies to support diverse students’ needs, community colleges play an important role in giving students access to college opportunities. This sector is central for Latinx students, as 54% of Latinx students attend community college (58,300 students), compared to 46% of Black students (32,900) and 46% of White students (143,000).[4] However, completion and transfer rates from two-year public colleges to four-year colleges point to limited opportunities. The completion rate for the state’s Latinx community college students is only 25%, compared to 37% for White community college students.[5] Though Illinois is lauded for leading the nation in graduation rates for transfer students, in 2017, only 17% of Illinois Latinx community college students transferred, compared to 23% of White students.[6]
One likely explanation for these gaps is developmental education. Most of Illinois’ Latinx community college students are placed into non-credit-bearing developmental education courses, which add time and cost barriers to degree attainment. Out of 100 Latinx students in community college, 62 are placed in remediation, and only 10 of those students graduate, compared to White students, who are 50% less likely to be placed in developmental education and 60% more likely to complete if they are placed into these courses.[7] Though much attention is focused on four-year institution disparities, more than 18,400 Latinx students were placed in community college developmental education courses in 2017, only 1,800 fewer Latinx undergraduates than attended all of the state’s public universities combined.[8] Placement into developmental education is to some degree related to inequities within Illinois’ K-12 education system that lead to differences in preparedness. However, studies show that traditional developmental education can be a barrier to students completing. Placement into these courses can be flawed in ways that over-enroll students of color and no identifiable student group has a better chance of advancing toward a degree if placed into these courses.[9]
Public four-year universities are meant to provide opportunities for Illinoisans to affordably earn degrees, but improving equitable attainment means better funding institutions serving Latinx students and having well-funded institutions better represent the state’s population. Opportunities at public universities are currently being stratified by race, as only 20% of Latinx students (21,100) go to public universities, compared to 24% of Black students (17,233) and 24% of White students (72,369). Only two of Illinois’ 12 public universities have a share of Latinx students that at least match the state’s racial and ethnic population of 18-24 year-olds. Further, the universities that have higher graduation rates, both for Latinx students and overall, are not the ones that are enrolling representative populations of Latinx students.[10]
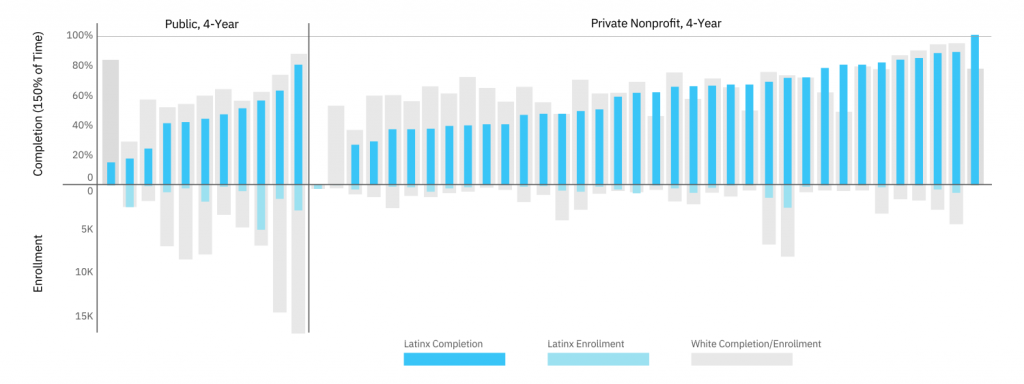
However, unequal opportunities to earn a degree are not just an issue at these two representative colleges. Significant completion gaps exist between Latinx and White students at all of the state’s public universities. Though Latinx students graduate at higher rates than they did twenty years ago, they haven’t gained any ground relative to White students, and these gaps were reinforced by a 4% decline in the Latinx student graduation rate for the latest cohort.[11]
Though more commonly discussed as a community college issue, remediation disproportionately limits Latinx student access at public universities, as well. Available data indicates that Illinois’ Latinx public university students are more than twice as likely to be placed into remedial courses, and after being placed in them, are half as likely to ever complete college-level courses.[12]
The private nonprofit sector is important to Latinx students in Illinois. About 21% of college-going Latinx Illinoisans, or 22,800 students, attend private nonprofit colleges. White students also attend private nonprofit colleges at a rate of 21% (63,500 students) and this is more than the 15% of Black students (10,500) attending college in this sector.[13] Data from the Cappex college discovery platform shows that Latinx students were more likely to inquire about private colleges than either White or Black students.[14] Further, Latinx community college students are disproportionately transferring to private institutions–31% of Latinx community college transfers go to private colleges, compared to 22% of White transfers.
The private nonprofit sector is often seen as producing better opportunities for students, but Illinois private colleges vary in outcomes such as completion rates. There are 42 colleges that have a lower percentage of Latinx students than the state’s population, compared to only 20 that are representative, and on average these non-representative colleges are more selective and have higher completion rates, both overall and for Latinx students, than representative colleges.[15] However, completion gaps exist at nearly all of Illinois’ private colleges, with 54% of Latinx students completing, compared to 63% for White students.[16]
The share of Latinx college-going students enrolled in Illinois’ for-profit colleges is not as large as Black or White students, as only 5% of Latinx students (5,200) attend college at this sector, as opposed to 6% of White students (19,300) and 13% of Black students (9,120).[17] However, Latinx enrollment is also showing no signs of abating, despite overall declining enrollment in Illinois for-profit colleges amidst mounting evidence that this sector produces subpar outcomes at high costs (see Ability to Pay and Payoff sections).[18]
At most colleges, there are large gaps in Latinx and White students’ graduation rates, and Latinx students are under-represented at institutions with smaller completion gaps
Undocumented Issues and Illinois Students
Illinois has at least 1,500 undocumented students eligible for state financial aid, though that number is likely very conservatively estimated. It is probable that the majority of these students are Latinx.[19] Undocumented students, as well as those living in undocumented or mixed-status families, face a unique set of higher education barriers. Undocumented students are not eligible for federal aid, and until the passage of the RISE Act in 2019 were also unable to receive state aid.[20] Some nonprofit organizations and institutions, such as City Colleges of Chicago through their Star Scholarship, provide undocumented students with financial aid, but overall significant financial barriers exist. Students with undocumented parents also face difficulties applying for federal financial aid, and recent federal actions may make families wary of filling out these forms,
The RISE Act was a necessary first step in providing financial aid for undocumented students. However, until MAP is extended to all eligible applicants, this first-come-first-served funding will likely still fall short for many undocumented students. Further, Illinois must provide clear paths for undocumented students to navigate public college admissions, enrollment, and financial aid.
Access Issues and the Quality of Educational Experience
Access barriers discussed in this report are the most apparent and measurable factors affected by affordability, but they are hardly the only ones. In interviews, students mentioned numerous programs and opportunities that they would like to access, if affordability weren’t an issue, such as attending college on-campus, going to law school, studying abroad, living on-campus, and taking unpaid internships in their field of interest. “I can’t afford to do an unpaid internship, but if I could have I would have considered internships in D.C. or abroad,” said a student who wants to work in policymaking. “But a lot of the big [internships] with state legislators or on Capitol Hill were all unpaid, so I didn’t even consider them. And you have to pay for your rent there and travel. It just didn’t seem feasible if I wasn’t being paid at all.” Though hard to measure, not having these opportunities limits the experiences of students in the short-term and may affect future career opportunities in the long-term. This student also spoke about how, with more time and resources, she could have explored a minor in film and media studies, and a semester abroad. “There are areas of study I wish I had time to explore, but I can’t,” she continued, “because I have jobs here that I can’t just up and leave. I can’t afford to not work.”
Policy Recommendations to Improve Access in Illinois Higher Education
- Convene an equitable funding formula work group
- Create a statewide direct admissions program
- Place fewer students into traditional developmental education
- Improve transfer pathways
For details on each recommendation, see the Improving Access secction.
Part 2: Cost
Studies show that high costs are one of the main factors that drive Latinx students to attend community colleges at greater rates than White students across the country.[21] At the same time, with limited access to lower-cost options, Latinx students seeking four-year degrees tend to enroll in four-year colleges that end up being more expensive. With narrow financial margins, the thousands of dollars and hundreds of hours Latinx students spend in the classroom are especially costly.
The first step in narrowing racial completion gaps is acknowledging that as long as costs are very high and payoffs of a degree are lower, students will attend colleges that are less expensive or appear to have a quicker return on their investment, stop out of college, take longer to graduate, or not attend college at all. These are the unavoidable effects of shifting costs from state funding to students, and they disproportionately fall on Latinx students. Lowering college costs for Latinx students has the potential to reverse access issues, improve persistence and completion, and for Illinois to achieve its goals for equity and college attainment.[22]
Perceptions of Affordability
How students perceive price affects access and retention, as estimations of college costs can prevent students from applying, enrolling, or cause them to stop out. High sticker prices may discourage Latinx students from applying and enrolling in the 17 selective colleges in Illinois, where tuition and fees average $34,195, compared to $14,681 at Illinois’ less selective colleges.[23] Data from the Cappex college platform shows that Illinois Latinx students were less likely to inquire about more selective colleges than White students.[24]
Latinx students are more likely to face additional barriers in navigating college and its costs. Latinx students are more likely to be first generation college students, and according to survey data, Latinx parents are more likely to underestimate the costs of college than White parents.[25] An interviewed student explained some of the difficulty getting and sharing information on costs with her family: “my parents migrated here from Mexico, so I’m first generation American as well as a first generation college student, and I’m actually the first person in my entire extended family to go to college.” This student is part of the 75% of FAFSA-filing Latinx students in the Chicago region who are first generation students, compared to 30% of White filers.[26] “Because I’m first generation, I didn’t realize that tuition increases were something that I even had to consider… and my parents and a lot of my family are not aware that there are three more years of law school [to pay for] after this.”
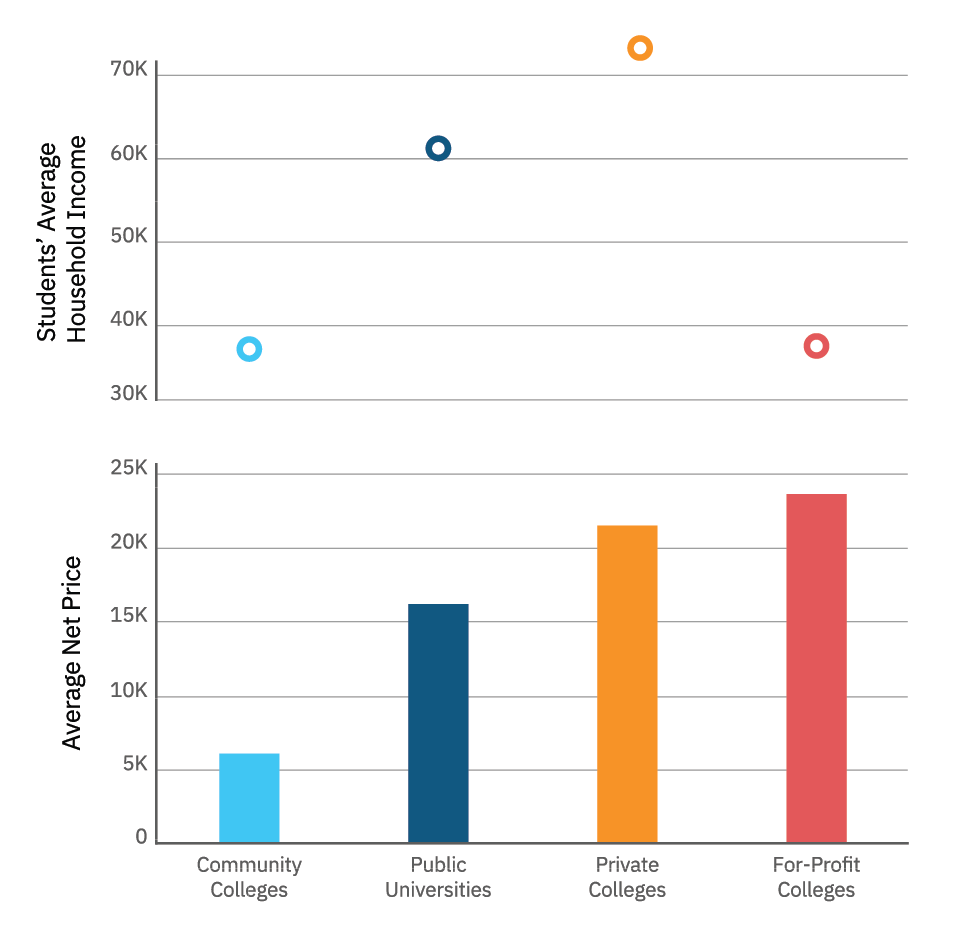
Average Net Price
The average cost of attendance, including tuition and fees, books and supplies, and living expenses, minus the average grant/scholarship aid. This report looks at average net price overall, but also specifically for students with family incomes from $0 to $30,000, to see how affordable colleges are for low-income students.
The Price Students Pay by College Sector
Given their relative affordability, community colleges can put degrees within reach for students. Considering Latinx students disproportionately attend these institutions, they have become an essential part of college-going affordability in Illinois. On average, students pay a net price of $6,200 to attend community college in Illinois, $10,000 less per year compared to public universities.[27] By improving the placement of students and delivery method of developmental education, as well as improving academic pathways, additional costs for students can be limited, improving affordability. Community colleges are integral both in providing short-term degrees that improve employment prospects as well as transfer opportunities, which can lower the overall cost of four-year degrees.
Illinois’ public universities are among the most expensive in the nation in terms of net price at all income levels, but especially for households that make less than $30,000 per year, which is true of 26% of Illinois’ Latinx families.[28] For these households, the net price is $12,800, among the highest in the nation, and 50% more than the average cost among public universities in the midwest.[29]
Though private nonprofit colleges often cite low overall costs for low-income students after accounting for institutional aid, actual costs of college are far higher than at public institutions; students whose families make less than $30,000 pay about $17,500 per year at private four-year colleges. The 42 private colleges that enroll non-representative populations of Latinx students are able to charge less for low-income families, though the students they serve have on average $24,300 more in household income than students at representative colleges, further illustrating how Latinx students do not have equitable access to college.[30]
Latinx for-profit students pay more than those enrolled in any other sector. At Illinois’ for-profit institutions, the net price for a student whose family makes less than $30,000 is about $22,000 per year.[31] There are many rational reasons students choose these institutions, despite the higher cost, including marketing efforts, promised job placement, flexibility, ease of access, time to degree, and responsiveness.[32] However, the high prices of these institutions compared to public and private nonprofit colleges, and that Latinx students continue to enroll in these colleges, speaks to the lack of access to lower-cost public and private nonprofit four-year institutions.[33]
Opportunity Cost
College is often spoken of as an investment. However, unlike putting savings in the stock market, the decision to spend one’s time attending college comes at the direct expense of making money, unless a student has wealth or the ability to take on debt with little consequence. This trade-off, commonly referred to as opportunity cost, is hard to observe. However, when asked directly, surveyed Latinx college students put much greater value on having resources now than in a year.[34] This could be an unseen contributor to access issues, as students forgo college opportunities with better long-term payoffs for ones that offer short-term returns, lower costs, and/or less debt.[35] Having less money in the bank means a student is essentially paying far more for every hour they are in a classroom instead of working.
Opportunity cost may be apparent in Latinx students’ work trends. Latinx students in Illinois work more hours than students of any other student population, and a greater percentage of Latinx students said that their work affected their class schedule than White students.[36] A greater need to work may be a factor in Latinx bachelor’s degree graduates taking an extra year to complete at four-year private colleges and three months more at public universities, compared to White students.[37] To this point, Latinx Illinoisans are the most likely of any race or ethnicity to state minimizing loans as their reason for working while in college.[38]
Opportunity cost is also a major factor in more students enrolling in community colleges during recessions, as going to college becomes a more attractive option when jobs are scarcer.[39] Latinx student enrollment spiked in Illinois during the latest recession. This growth was an opportunity for the state to improve the educational attainment and employment prospects of workers, but Latinx graduation rates dipped for the first time in 14 years during this recession, signaling affordability and other institutional barriers for this influx of students.[40] Policies such as targeted grant programs can help encourage and support students to complete degrees, ultimately increasing the state’s educated workforce.
Students with lower income disproportionally attend community colleges and for-profit colleges
Policy Recommendations to Decrease the Cost of a Degree
- Better fund public institutuions
- Eliminate MAP at for-profit institutions
- Offer completion grants
For details on each recommendation, see the Decreasing the Cost of a Degree section.
Part 3: Ability to Pay
The greatest affordability gaps are in the different resources that Illinois Latinx and White students have to pay for college. This is apparent by household income, but is most evident in wealth disparities, as Latinx students start college with very thin margins for discretionary spending as compared to White students.
Loans are often necessary to cover the previously outlined costs, but Latinx students in Illinois borrow less than other students, and far less than Black students, who face similar wealth and income disparities. “Personally, I’m scared of taking out loans. If I can avoid it I will,” said an interviewed student, who had already taken out more than $10,000 in her first year at a private university. Data from Illinois tell a deeper story than just a case of “under-borrowing,” as Latinx students who do borrow face especially precarious outcomes. Meanwhile, Latinx students have been increasingly less able to rely on state aid to cover the difference.
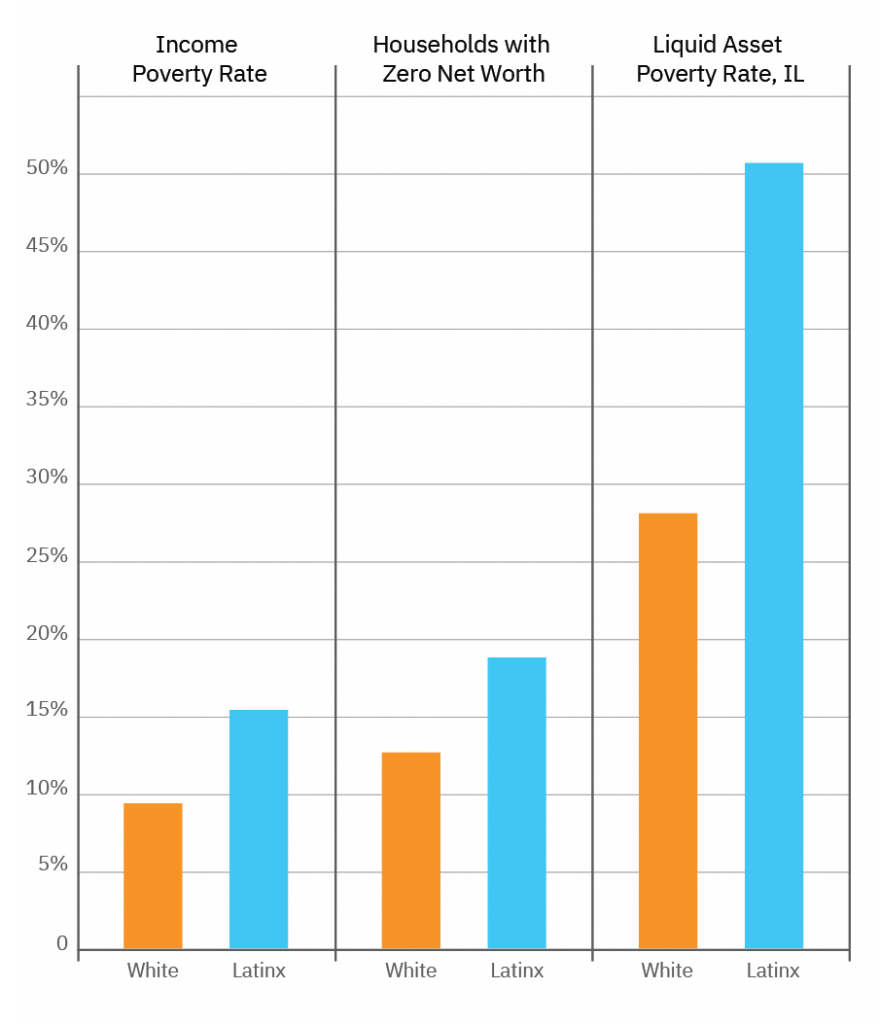
Latinx Illinoisans have greater rates of wealth and income poverty
Income Gaps
Typically, household income is used as a measurement of a family’s ability to pay for college. In Illinois, the median Latinx household makes about $46,000, compared to $62,000 for White households, and is 65% more likely to have an annual income below federal poverty levels.[41] These disparities contribute to Latinx families paying 39% of their income to attend public universities and 49% for private universities, compared to White families paying 31% and 35%, respectively. Similar racial gaps exist at public two-year colleges, as well.[42]
Wealth Disparities
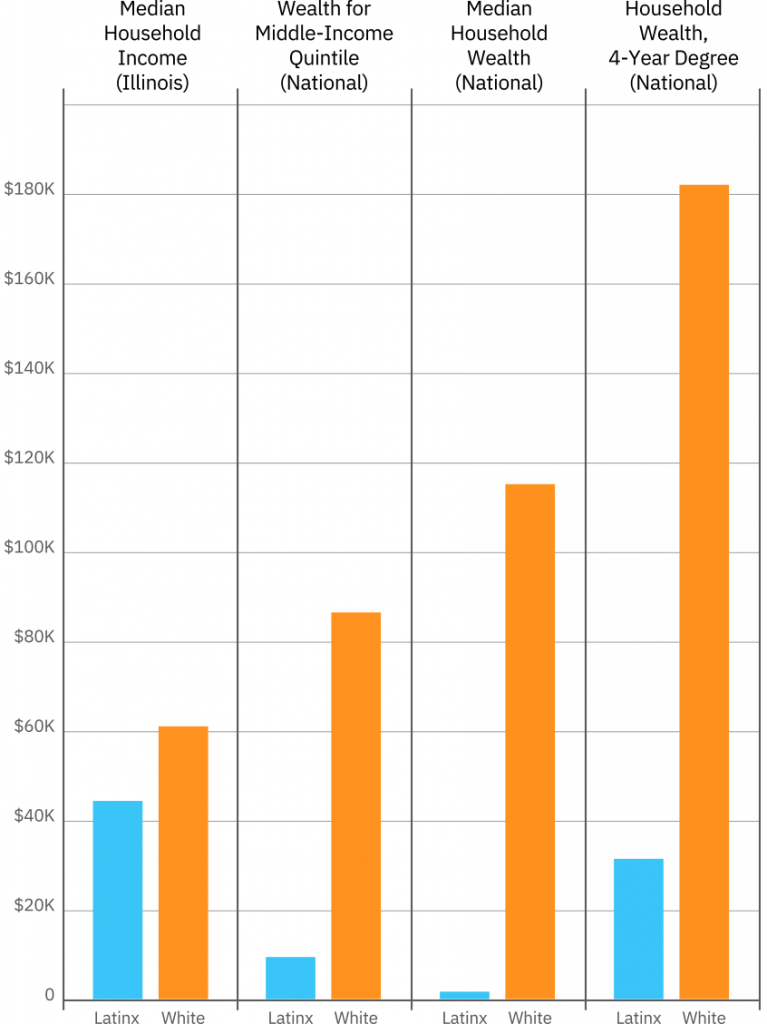
Though income is important, a family’s wealth, both in a more liquid form (like a savings account) or non-liquid (such as housing) provide resources and stability that are crucial in persisting through years of college expenses. Racial wealth gaps have been formed over generations of discriminatory policies that made assets, especially housing, easier for White families to accumulate, and in Illinois these gaps are significant. The median Latinx family in America has about $14,000 in wealth, compared to $134,000 for White families, and in Illinois the median White family has an even higher net worth considering durable goods like cars and furniture, which cannot directly be used to fund college. Without durable goods, the median White family in America has 50 times the wealth of the median Latinx family.[43] In Illinois, more than half of Latinx families live in liquid asset poverty, meaning that their savings cannot cover three months of basic expenses, compared to 28% of White families.[44] Discussions of students’ ability to pay often gloss over race and instead focus on being high-income or low-income, but these differences in wealth show how incomplete that measure can be. For example, the typical Latinx family with middle class income has just $6,000 more wealth than a White family with one-third of their income, whereas the typical White family with their income would have $120,000 more.[45]
Racial wealth gaps threaten college completion in many ways. For example, the parents of Latinx students are less likely to be able to provide financial support compared to White students.[46] The connection between race, wealth, and college persistence was apparent in a study of student loans and college persistence, which showed White students were significantly more likely to graduate than Latinx students, but controlling for household net wealth diminished this effect.[47]
Taking on and Paying off Debt
In lieu of wealth, the ability and willingness to take on debt can determine if students have the resources to persist in college. Studies show that Latinx students are less likely to borrow than White or Black students.[48] Illinois data reflects those findings, as surveyed Latinx students take on about the same amount of debt as White students at four-year colleges and universities, and less than Black students, despite facing a similar lack of wealth.[49] This is not explained by Latinx students being less likely to finish as the same is true when only looking at college graduates. As an interviewed sophomore at a private college said, “I feel sometimes like I’m already starting to hit my limit [on taking out loans] because I am feeling the pressure. I know how much I’ve taken out.”
Studies show that debt-averse borrowers choose colleges with lower costs. This is likely one factor contributing to Latinx students enrolling in community colleges at higher rates, which in Illinois have a fraction of the rate and amounts of borrowing compared to public and private universities.[50] Studies also show that debt aversion is related to disparities in how much information Latinx students have on borrowing.[51] To this point, Illinois Latinx borrowers were the most likely of any race or ethnicity to avoid loans because they did not know how to apply or because they believed they were ineligible.[52]
There are significant wealth and income gaps between Latinx and White households
However, this is not merely an issue of under-borrowing, with a simple solution of encouraging Latinx students to take out more loans. Borrowing is a complex calculation which depends on a students’ wealth, income, college situation, and the income they anticipate after graduating. There are racial gaps in the outcomes of borrowing, too, as Latinx undergraduate students are 61% more likely to default on student loans than White students.[53] Surveyed Latinx students in Illinois report higher rates of forbearances and deferments per loan, and perhaps surprisingly given borrowing rates and amounts, they report the greatest levels of stress from education-related debt of any race.[54] At Illinois private colleges, these issues are especially evident, as having more Latinx students is significantly correlated with students not being able to repay their debt after five years.[55] Finally, though Illinois Latinx students borrow less on average, they are still more likely than White students to owe large amounts of debt at all institution types, showing that many of those who borrow end up borrowing large sums.[56]
The kind of debt Latinx borrowers are taking out is also of concern for Latinx students. Private loans often have high interest rates and are riskier than federally backed loans, which makes their use among Latinx students problematic. “Paying for college is pretty front of mind for me, because I have government loans and one private loan that I took out last year to pay for room and board and the left-over tuition that I had to pay,” said an interviewed Latinx student. “I maxed out the public loans, I didn’t have a high-paying job, and my parents didn’t have the ability to pay for those costs, so I had to take out a private loan.” Surveyed Latinx students in the state are more likely to take out private loans, and private loans taken out by Latinx students are much more likely to have high interest rates than those taken out by White students.[57] At private colleges, having more Latinx students is correlated to students taking out more money in private loans.[58] This affects students’ families, too, as the private student loan industry is increasingly requiring co-signers on private loans–67% of these loans required a co-signer in 2008, and by the end of the recession in 2011, that number was up to 90%.[59]
Latinx students borrow the most and have the lowest chance of repaying the loans at for-profit institutions. Latinx graduates of for-profit institutions owe nearly $18,000 on average, more than any other race or ethnicity.[60] This amount is second only to the private nonprofit sector, where Illinois students default on loans less than 8% of time, compared to the state’s for-profit colleges, which average 23% of their students defaulting on student loans within four years of taking them out. Further, Illinois for-profit students who default do so with an average of $15,000 in debt.[61] For-profit sector outcomes are often compared to community colleges, but in Illinois students at the public two-year colleges default at a lower rate, and those defaulting do so with an average of less than $5,000.
The combination of for-profit enrollment and private loans is precarious for Latinx students. Federal undergraduate loans typically have about a 4.5% interest rate, but half of Latinx students at for-profit colleges pay interest rates above 8%,
compared to only 20% of White students at those institutions.[62] That Latinx student enrollment in for-profit institutions has slightly increased over the last three years, even as 2,000 fewer Black students have enrolled, underscores how other college sectors may not be fully meeting Latinx students’ demand for college opportunities.

Policy Recommendations to Increase Students’ Ability to Pay
- Increase state investment in the Monetary Award Program
- Eliminate or reform merit-based aid
For details on each recommendation, see the Increasing Students’ Ability to Pay section,
State and Federal Aid
Federal and state aid are meant to make up the difference between a college’s cost and what a family can afford to pay, and this is especially important in Illinois, which has large racial disparities in expected family contribution (EFC).[63] The average EFC is $8,200 for Latinx families, compared to $11,500 for White families.[64] However, state aid has become less reliable and meaningful after nearly two decades of disinvestment. This has turned the state’s Monetary Award Program (MAP) into a first-come, first-served grant that in Fiscal Year 2018 denied awards to nearly 100,000 qualified students. For students at four-year colleges and universities that did receive funding, it only covered about one-third of their tuition and fees.[65] Latinx students are more likely to be low-income, so aid shortages disproportionately affect them. They are also more likely to attend community colleges, at which the state fails to cover 68% of eligible MAP applicants, compared to 21% at public four-years. They also are more likely to be placed in developmental education, which, until the RISE Act of 2019, had limited coverage of these courses. Finally, MAP grants only cover 13% of tuition and fees at private universities, where Latinx transfer students disproportionately enroll.[66]
Worse, in Fiscal Year 2016 and Fiscal Year 2017, the State of Illinois operated without a budget, turning the persistent issue of state aid shortages into a dire situation, as colleges couldn’t guarantee these funds to students. Notably, many colleges and universities guaranteed this funding to students during the impasse. However, in an ISAC survey during one of the delays in MAP funding, about half of respondents said that this funding uncertainty affected their educational goals, hundreds reported dropping out of school because of it, and about half said that they increased working hours and/or decreased credits taken to make up for this funding loss.[67] Sudden changes in costs and availability of financial aid can cause students to discontinue their education, and unfortunately MAP shortcomings make this an annual risk for tens of thousands of Latinx students in Illinois.[68]

Payoffs of a Degree
Earning a college degree is often assumed to have certain universal economic payoffs for the graduate, such as steady employment, a lifetime pass into middle class earnings, and a comfortable level of wealth for future generations. Indeed, a degree is transformative financially, as Latinx graduates boost their earnings by 78% over a high school diploma.[69] However, research and data also show that the payoff of a college degree is not the same for Latinx and White Illinoisans.
Employment and Income Disparities
Nationally, Latinx bachelor’s degree holders earn about 80 cents for every dollar that White graduates earn, and over the course of a lifetime this adds up to hundreds of thousands in lifetime income.[70] It’s also harder for Latinx graduates to find jobs in general, as greater percentages of young Latinx graduates are unemployed and underemployed, relative to White graduates.[71] Income gaps are in part related to discrimination in the labor market and other socioeconomic factors that should be examined further and are beyond the scope of this report. However, fixing inequitable enrollment and completion in higher education, particularly at public universities, is an essential part of closing income gaps, as well.
Future Wealth and Debt
The differences in wealth among Latinx and White college graduates show that while a degree greatly increases a graduate’s earning power, it does little to close the wealth gap. The median wealth of Latinx college graduates is $33,000, compared to $181,000 for White four-year degree earners.
Further gaps are shown in the debt Latinx students take on and their ability to pay it off. A recent study found that 12 years after college, the typical White student had paid back about half of their original student loan amount, but Latinx bachelor’s degree holders only paid down 20% of their loans, and college non-completers and associates degree holders had the same loan balance as when they finished college.[72] Latinx student borrowers are also 61% more likely to default on student loans than White students, and this difference is almost completely explained by background characteristics such as family wealth and income.[73] In Illinois, enrolling more Latinx students is correlated with lower repayment rates on loans for community colleges and private colleges, potentially reflecting how payoffs are being limited for graduates.
Having a large debt burden affects students’ future wealth in far-reaching ways, beyond just having to pay off debt with interest. Demos’s At What Cost study estimates that taking $53,000 in debt (average for a household with two bachelor’s degrees) is equivalent to a loss of $208,000 in lifetime wealth. This wealth loss mainly takes the form of less retirement savings and home equity, two staples of socioeconomic stability. Further research estimates that every additional $1,000 of student loan debt is associated with about 2% lower likelihood that that person will own a home (and Illinois Latinx college graduates have $2,000 more debt on average than their White counterparts).[74]
The American dream of college attainment is multigenerational, with middle class jobs and income more assured to the children of college graduates. Illinois data shows, however, that given current policies and practices, Latinx graduates are less able to pass on the positive effects of college attainment to their children. Latinx children born into a household with middle-class income in Illinois have a 31% chance of getting a college degree, compared to 45% for White children from the same income quintile.[75]
Policy Recommendations to Improve Degree Payoff
- Targeted debt forgiveness programs
For details on each recommendation, see the Improving Degree Payoff section.
Conclusion
The number of Latinx college students in Illinois has grown tremendously over the last twenty years, which speaks to the drive and hard work of thousands of students seeking opportunity. However, access and completion gaps have been maintained by persistent, and in some cases growing affordability barriers. Latinx students disproportionately attend community colleges, the most affordable college option, but too often get derailed from completion and/or transfer to four-year institutions by developmental education courses. Private colleges offer unique opportunity for Latinx enrollees and transfer students, but these opportunities are limited by the high costs in this sector. Latinx students need more affordable access to all of the state’s four-year universities, which should better represent the population of the state that funds them.
Most significantly, though, Illinois needs to make college more affordable if it hopes to reach its attainment goals. Latinx students may be wary of borrowing against their future–of all students, Latinx students are the least likely to say that loan debt was a worthwhile investment–but the current outcomes of borrowing unfortunately make this a rational position.[76]Perhaps the stability of growing MAP grants will ease some of that uncertainty; however, stability is not a substitute for resources, and greatly expanding student aid and institutional appropriations are the best methods toward providing Latinx students with the funds they need to persist.
Equitable college completion for Latinx students is both a moral and economic imperative for Illinois. The state faces declining college enrollment. With the Latinx population set to level off and then decline, increasing the retention and completion rates of current students is necessary to stave off further enrollment drops. Illinois’ economy is already suffering from inequality in its educated workforce.[77] Improving college access and completion rates for Latinx Illinoisans by focusing first on affordability is paramount in keeping the economy growing, and growing equitably.
References
1. Illinois Board of Higher Education. “Table II-2: Total Awards by Gender, Race or National Origin, and Type of Institution, and Level of Instruction FY 2017.” IBHE Databook. Accessed November 8, 2018. There was an increase of about 9,600 Latinx students at public universities and 10,700 Latinx students at private non-profit colleges and
2. “Data—Knocking at the College Door.” WICHE Projections of High School Graduates. Accessed July 29, 2019. and “Table VI-13: Degrees Conferred Data.” IBHE Databook, n.d.
3. Illinois Board of Higher Education, “Table II-2: Total Awards by Gender, Race or National Origin, and Type of Institution, and Level of Instruction FY 2017.”and Illinois Board of Higher Education, “Table VI-13: Degrees Conferred Data.” Looking in terms of six-year completions, the Illinois Latinx public high school population grew by 110% from 2001-2011, but the Latinx public university and private non-profit degrees conferred grew by only 79% from 2007-2017.
4. Illinois Board of Higher Education, “Chapter I & Table I-2.”
5. U.S. Department of Education. “College Scorecard Data.” College Scorecard, May 21, 2019.
6. Hahn, Melissa. “New College Transfer Report.” IBHE News, September 4, 2018.
7. Data provided by the Illinois Community College Board (ICCB)
8. “Table I-3: Race or National Origin of Students Enrolled in Illinois Colleges and Universities by Type of Institution.” Illinois Board of Higher Education, Fall 2017.
9. “Policy Brief: Remediation Reform.” Partnership for College Completion, March 2019.
10. “The Integrated Postsecondary Education Data System.” IPEDS: Use The Data. Accessed May 24, 2019. and “American FactFinder.” U. S. Census Bureau. Accessed May 24, 2019.
11. “Trend Generator: Graduation and Retention Rates.” National Center for Education Statistics. Accessed July 31, 2019.
12. Complete College America. “Remediation: Higher Education’s Bridge to Nowhere,” April 2012.
13. Illinois Board of Higher Education, “Table I-2: Total Fall Enrollments by Gender, Race or National Origin, and Type of Institution, and Level of Instruction Fall 2017.”
14. Data provided by Cappex and College Greenlight
15. U.S. Department of Education, “College Scorecard Data.””
16. “The Integrated Postsecondary Education Data System.”
17. Illinois Board of Higher Education, “Table I-2: Total Fall Enrollments by Gender, Race or National Origin, and Type of Institution, and Level of Instruction Fall 2017.”
18. Deming, David J., Claudia Goldin, and Lawrence F. Katz. “The For-Profit Postsecondary School Sector: Nimble Critters or Agile Predators?” Journal of Economic Perspectives 26, no. 1 (February 2012): 139–64.
19. “Frequently Asked Questions.” Student Access Bill. Accessed May 30, 2019. and Tsao, Fred. “Illinois’ Undocumented Immigrant Population: A Summary of Recent Research by Rob Paral and Associates.” Illinois Coalition for Immigrant and Refugee Rights, February 1, 2014. and “Support for Undocumented Students in Illinois 4-Year College Campuses.” presented at the 2nd Annual Sharing the Dream Conference, University of St. Francis, May 18, 2016.
20. “Policy Brief: Remediation Reform.” The Retention of Illinois Students Equity (RISE) Act, passed in May 2019, expands eligibility for state need-based financial aid to undocument- ed students, transgender students who have not registered for Selective Service, and students who fall under a 75-credit-hour maximum for aid from the state. “Illinois General Assembly – Full Text of HB2691.” Accessed October 4, 2019.
21. Wood, J. Luke, and Frank Harris. “The Effect of College Selection Factors on Persistence: An Examination of Black and Latino Males in The Community College.” Journal of College Student Retention: Research, Theory & Practice 16, no. 4 (February 1, 2015): 511–35. and Carnevale, Anthony P., and Megan L. Fasules. “Latino Education and Economic Progress: Running Faster but Still Behind.” CEW Georgetown (blog), October 11, 2017.
22. These goals are articulated in Illinois’ 60×25 initiative, a legislative priority with the goal of having 60% of the state’s adults having a high-quality degree or credential by the year 2025.
23. Carnevale and Fasules, “Latino Education and Economic Progress.”
24. U.S. Department of Education, “College Scorecard Data.” and data from College Greenlight and Cappex
25. Velez, Erin Dunlop, Laura Horn, and Elise M. Christopher. “What High Schoolers and Their Parents Know About Public 4-Year Tuition and Fees in Their State.” Stats in Brief. National Center for Education Statistics, October 2018.
26. Abrahamson, Michael, and Lisa Castillo Richmond. “College-Going and Completion in the Chicago Area: A Regional Analysis.” Partnership for College Completion, July 2019.
27. U.S. Department of Education, “College Scorecard Data.”
28. U.S. Census Bureau, “American FactFinder.”
29. “The Integrated Postsecondary Education Data System.” This uses the NCES definition of the Great Lakes region., which includes Illinois, Indiana, Michigan, Ohio, and Wisconsin.
30. Ibid.
31. Ibid.
32. Cottom, Tressie McMillan. Lower Ed: The Troubling Rise of For-Profit Colleges in the New Economy. New Press, 2017.
33. U.S. Department of Education, “College Scorecard Data.”
34. “Baccalaureate and Beyond Longitudinal Study (B&B 2008:2012).” U.S. Department of Education: National Center for Education Statistics, n.d.
35. Wescher, Lance, Travis Hutchinson, and Anna Rannou. “Minimum Wages, Employment, and College Enrollment.” The American Economist 64, no. 1 (2019): 3–18.
36. “National Postsecondary Student Aid Study: 2008 Undergraduates.” National Center for Education Statistics. Accessed July 31, 2019. This report uses the National Postsecondary Student Aid Study from 2008, the latest year for which Illinois-specific data is available. However, as noted throughout this report, the recession has only exacerbated the enrollment , wealth, and debt issues that Latinx students face.
37. Ibid.
38. Ibid.
39. Barr, Andrew, and Sarah E. Turner. “Expanding Enrollments and Contracting State Budgets: The Effect of the Great Recession on Higher Education.” The ANNALS of the American Academy of Political and Social Science 650, no. 1 (November 1, 2013): 168–93.
40. “Trend Generator: Graduation and Retention Rates.”
41. “Financial Insecurity in Chicago: A Data Profile.” Family Assets Count. Prosperity Now, June 2015.
42. “NCES PowerStats.” NPSAS:08
43. Asante-Muhammad, Dedrick, Chuck Collins, Josh Hoxie, and Emanuel Nieves. “The Road to Zero Wealth.” Prosperity Now, September 2017.
44. U.S. Department of Education, “College Scorecard Data.”
45. Asante-Muhammad et al., “The Road to Zero Wealth.” Middle income defined as $61,000 to $104,000.
46. “NCES PowerStats.” NPSAS:08
47. Zhan, Min. “The Impact of Youth Debt on College Graduation.” Journal of Sociology and Social Welfare 41 (January 2014).
48. “Student Aversion to Borrowing: Who Borrows and Who Doesn’t, By Race/Ethnicity.” Excelencia in Education and The Institute for Higher Education Policy (IHEP), n.d.
49. “NCES PowerStats.” NPSAS 08
50. “Student Aversion to Borrowing: Who Borrows and Who Doesn’t, By Race/Ethnicity.” and U.S. Department of Education, “College Scorecard Data.”
51. Ibid.
52. “NCES PowerStats.” NPSAS 08
53. Scott-Clayton, Judith. “What Accounts for Gaps in Student Loan Default, and What Happens After.” Brookings (blog), June 21, 2018.
54. “NCES PowerStats.” NPSAS 08
55. U.S. Department of Education, “College Scorecard Data.”
56. “NCES PowerStats.” NPSAS:08 Looking at the percentage of students owing more than $15,000 in debt
57. Ibid.
58. U.S. Department of Education, “College Scorecard Data.”
59. Ibid.
60. “NCES PowerStats.” NPSAS:08.
61. Miller, Ben. “How You Can See Your College’s Long-Term Default Rate.” Center for American Progress, August 30, 2018.
62. “NCES PowerStats.” NPSAS 08
63. The EFC formula takes into account dependency status; taxed and untaxed income, assets, and benefits of the student’s family (i.e. unemployment, social security, etc.); family size; and the number of family members who will attend college or trade school during the year.
64. Ibid.
65. “Basic ISAC Program Data.” Illinois Student Assistance Commission, December 2018.
66. Ibid.
67. “FY17 MAP Grant Survey: What Is the Impact on Students?” ISAC Research Brief, December 2016.
68. Conger, Dylan, and Lesley J. Turner. “The Effect of Price Shocks on Undocumented Students’ College Attainment and Completion.” Journal of Public Economics 148 (April 1, 2017): 92–114.
69. Carnevale, Anthony P., Jeff Strohl, Martin Van Der Werf, Michael C. Quinn, and Dmitri Repnikov. “Separate and Unequal: How Higher Education Reinforces the Intergenerational Reproduction of White Racial Privilege.” Georgetown Center for Education and the Workforce, 2018.
70. Carnevale, Anthony P., Stephen J. Rose, and Ban Cheah. “The College Payoff.” Georgetown University: Center on Education and the Workplace, n.d. Income gaps amount to Latinx associate’s degree holders making $1,500,000 over their lifetime, compared to closer to $1,900,000 for Latinx bachelor’s degree holders.
71. Gould, Elise, Zane Mokhiber, and Julia Wolfe. “Class of 2018: College Edition.” Economic Policy Institute (blog), May 10, 2018.
72. Miller, “How You Can See Your College’s Long-Term Default Rate.”
73. Scott-Clayton, “What Accounts for Gaps in Student Loan Default, and What Happens After.”
74. Mezza, Alvaro, Daniel Ringo, Shane Sherlund, and Kamila Sommer. “Student Loans and Homeownership.” Journal of Labor Economics, May 23, 2019. and “NCES PowerStats. NPSAS 08
75. “Data Library.” Opportunity Insights (blog). Accessed May 30, 2019.
76. “Beginning Postsecondary Students 2004/2009.” National Center for Education Statistics. Accessed July 31, 2019.
77. “Inclusive Growth – On to 2050 Strategy Paper.” Chicago Metropolitan Agency for Planning, July 2017.