On Illinois’ Disinvestment In Higher Education & What Can Be Done About It
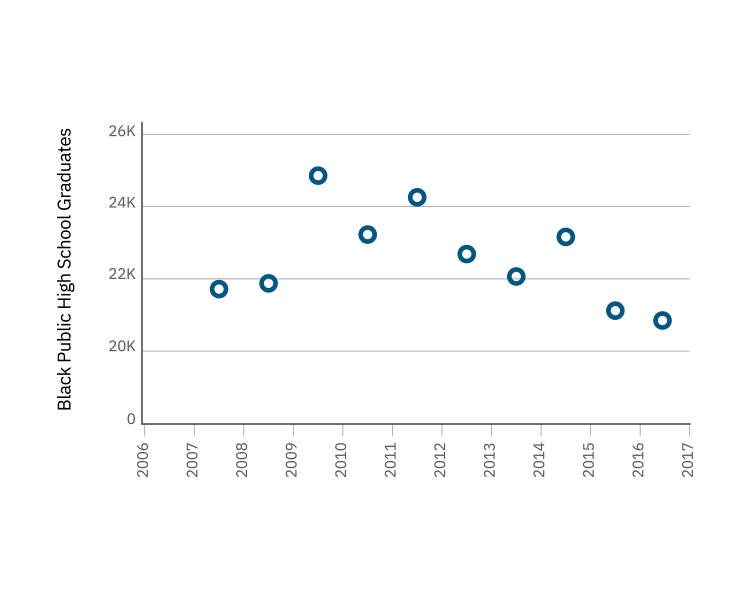
11,100 fewer Black students attended Illinois’ public and private-nonprofit colleges and universities in 2017 compared to 2007, despite similar numbers of Black public high school graduates during that time period.
This study, in conjunction with Priced Out: Latinx Students and Priced Out: Rural Students, analyzes the intersection of college affordability and degree completion to uncover the extent to which affordability impacts students in pursuit of a degree. The reports provide insight into how disparities in access, cost, and ability to pay are creating unique barriers for Illinois students across the state and recommends policy actions to start reversing these trends.

Affordability Lens
Access, Cost, and Ability to Pay
There are many ways to look at affordability issues, which touch every step of the college-to-career pipeline. In the interest of clearly analyzing how affordability relates to policy, the reports in PCC’s Affordability Study separate these issues into the categories of Access, Cost, and Ability to Pay.
- Access issues are differences in college opportunities associated with students’ race and/or place of birth
- Cost issues reflect the financial burden that students take on to enroll, persist, and complete college
- Ability to Pay disparities by race and income affect how students pay for these costs
Many topics in college affordability relate to a few or all of these categories, and accordingly these reports analyze them through these different lenses. For example, high cost private colleges can pose both an access issue, in that it can limit students’ ability to enroll and persist, and a cost issue, in how students attending these colleges must pay for their education.
Part 1: Access
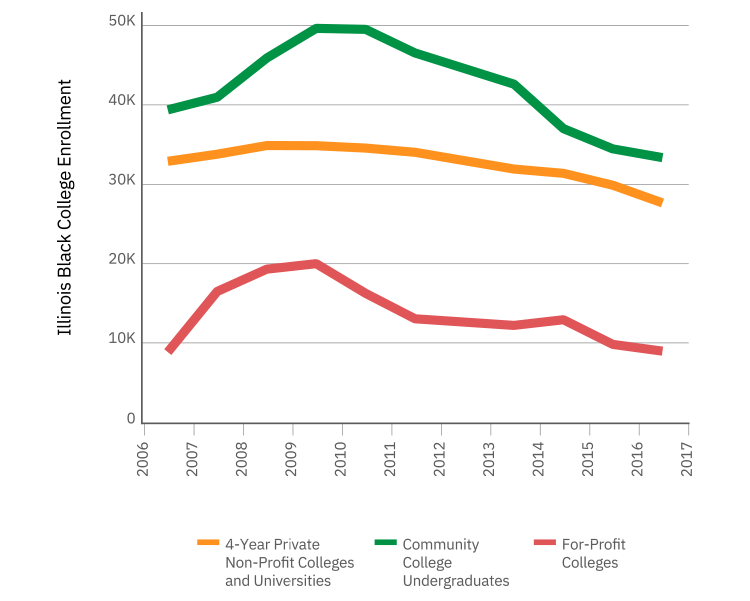
There has been a precipitous decline in enrollment for Black college students in Illinois over the last decade; 11,100 fewer Black students attended Illinois’ public and private-nonprofit colleges and universities in 2017 compared to 2007, despite similar numbers of Black public high school graduates during that time period.[1] Illinois may be in store for more dramatic declines, too, as the state is predicted to have 2,000 fewer Black high school graduates in 2023 than in 2018.[2] Thus, in terms of the overall pipeline to and through college, access to higher education continues to decline for Black Illinoisans. Though this study mostly focuses on challenges for students who do enroll in college, it is important to acknowledge the decline in Black student enrollment as a fundamental problem for the state, which is exacerbated by the affordability issues discussed throughout this report.
For Black students, decreased access often takes the form of unequal representation within different college sectors (i.e. two-year community college, four-year private nonprofit, etc.). The college sector students attend is important to affordability, as each has different costs, completion rates, and post-graduation payoffs. Of most concern, Black students are more than twice as likely as White students to attend for-profit institutions, which cost the most of any sector, have poor track records of increasing earnings, and average higher default rates on student loans.[3]
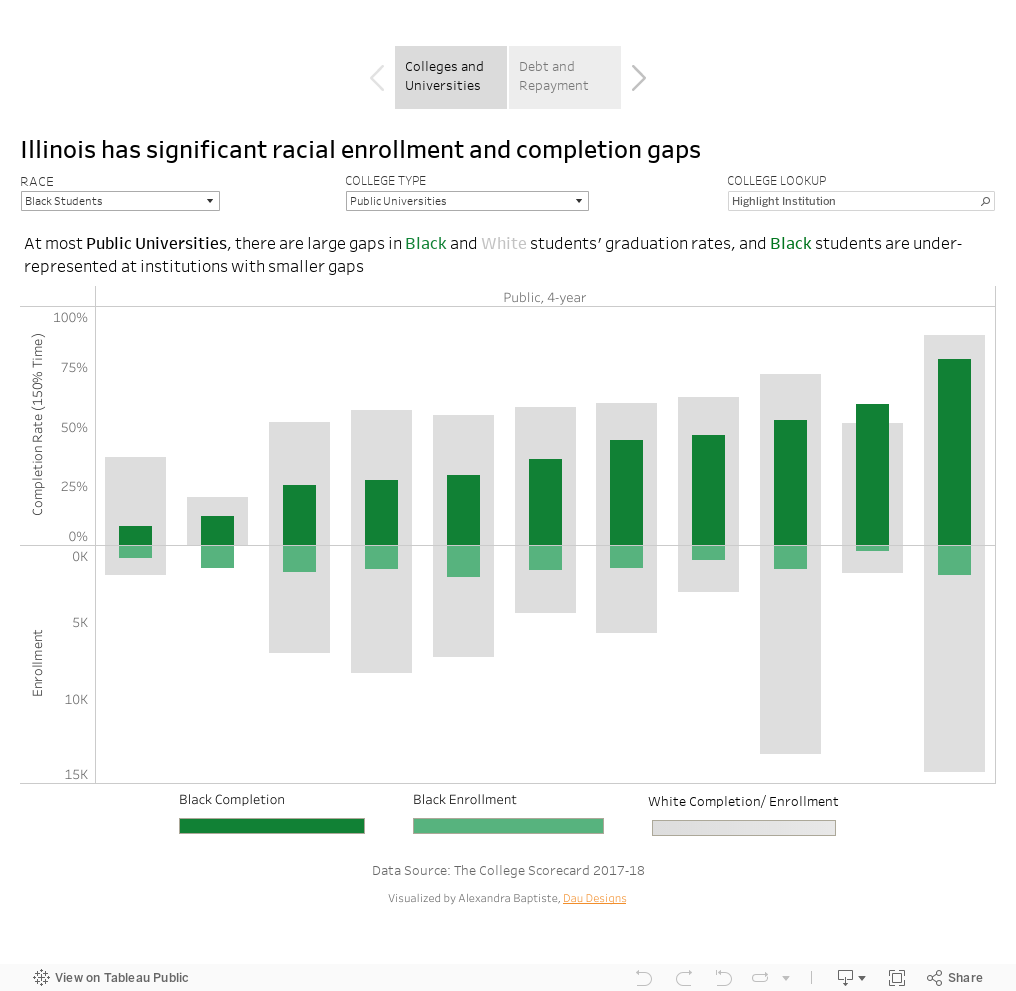
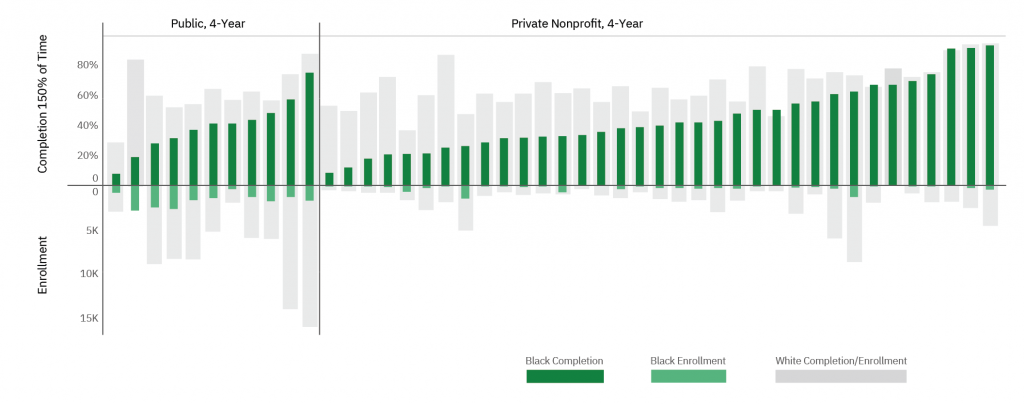
Looking within college sector also shows differential access by race, as public and private colleges with higher completion rates, transfer rates, and post-graduation incomes tend to enroll lower percentages of Black students. Further, the public universities that enroll lower percentages of Black students are also receiving the bulk of state appropriations, leaving institutions serving the largest percentages of Black students less resources to adequately support them. However, public universities are funded through taxpayer dollars to provide college access for Illinois students, and therefore should at least serve a percentage of Black students that represents the state that funds them. Moreover, universities that are enrolling at least a representative percentage of Black students must have greater resources to do so, as they are working to counteract large racial wealth disparities that can affect completion, covered in the Ability to Pay section of this report.
The number of black high school graduates is largely unchanged from 10 years ago
Black student enrollment has declined, except at for-profit colleges
Finally, there are completion gaps between Black and White students at nearly all colleges and universities, showing that Black students experience barriers within a college. This report also focuses on developmental education, which segments students into non-college level courses that are often the first and last stop for students in college. The way Black students are being over-placed and underserved in developmental education makes it both a civil rights and an affordability issue, as Black students are not being provided the same chances of earning a degree.
Black Representative and Non-Representative Institutions
This report outlines how Black students are not gaining access to certain public and private colleges at the same rates as White students. One way of measuring and discussing this is through representation: representative institutions are those that enroll 17% or more Black students, reflecting the population of 18-24 year old Illinoisans, and non-representative institutions fall short of that. This is illustrative for public universities, which should reflect the diversity of the state that funds them, and private colleges, in seeing what populations they are serving.
Black Student Access by College Sector
At most colleges, there are large gaps in Black and White students’ graduation rates, and Black students are under-represented at institutions with smaller completion gaps
Access Issues and the Quality of Educational Experience
This report discusses some of the most apparent and measurable factors affected by affordability, but they are hardly the only ones. In interviews, students mentioned numerous programs and opportunities that they would like to access, if affordability weren’t an issue, such as going directly to graduate school, studying abroad, living on-campus, and taking unpaid internships in their field of interest. Not having these opportunities limit the experiences of students in the short-term, and in the long-term affect future potential opportunities.
Policy Recommendations to Improve Access in Illinois Higher Education
- Convene an equitable funding formula work group
- Create a statewide direct admissions program
- Place fewer students into traditional developmental education
- Improve transfer pathways
For details on each recommendation, see the Improving Access section.
Part 2: Cost
Black students are paying a relatively greater price for college in Illinois than White students. This is mostly because racial disparities in wealth make Black students pay, work, and borrow more for the same opportunities (see, Ability to Pay). However, with limited access to lower-cost options, Black students tend to enroll in four-year colleges that end up being more expensive. With narrow financial margins, the thousands of dollars Black students could be saving, and hundreds of hours in classrooms that could be spent earning wages, are especially costly.
The first step in narrowing racial completion gaps is acknowledging that as long as costs are very high and payoffs are lower, students will attend colleges that are less expensive or that appear to have a quicker return on their investment, stop out, take longer to graduate, or not attend college at all. These are the unavoidable effects of shifting costs from state funding to students, and they disproportionately fall on Black students. Lowering college costs for Black students is paramount in improving college access, persistence, and completion, and for Illinois to achieve its goals for equity and college attainment.
Perceptions of Affordability
How students perceive price affects access and retention; estimations of college costs can prevent students from applying, enrolling, or cause them to stop out. High sticker prices may discourage Black students from applying and enrolling in the 17 most selective colleges in Illinois, where the posted tuition and fees at these colleges average $34,195, compared to $14,681 at Illinois’ less selective colleges.[20] While 60% of Illinois White student inquiries on the Cappex college platform were directed to these 17 colleges, only 49% of Black student inquiries on the platform were for these colleges.[21] High sticker prices are not only a feature of private colleges, as Illinois’ flagship university posts the nation’s fifth-highest in-state tuition and fees.[22]
Average Net Price
Average Net Price: the average cost of attendance, including tuition and fees, books and supplies, and living expenses, minus the average grant/scholarship aid. This report looks at average net price overall, but also specifically for students with family incomes from $0 to $30,000, to see how affordable colleges are for low-income students.
The Price Students Pay by College Sector
Community colleges can put degrees within reach for students, as these colleges are well-priced relative to four-year institutions. On average, students pay a net price of $6,200 to attend community college in Illinois, $10,000 less per year compared to public universities.[23] Improving the placement of students and delivery method of developmental education, as well as improving academic pathways, can further limit unnecessary costs for students. However, community colleges are integral both in providing short-term degrees that improve employment prospects as well as transfer opportunities, which can lower the overall cost of four-year degree.
At all income levels, Illinois’ public universities are among the most expensive in the country in terms of net price. For students whose families make less than $30,000 per year, which is true of 41% of Illinois’ Black families, net prices are especially high.[24] For students from those families the cost is $12,800, among the highest in the nation, and nearly 50% more than the average cost among public universities in the midwest.[25] “I was between paying $13,000 in loans [to attend a private college] or $16,000 in loans [to attend a regional public university in Illinois] and [private college] is just a better investment,” said an interviewed student, who ended up going to the private college and covering most of that amount in institutional scholarships. The student explained, “I did get into [selective public university] program, but then I thought about the loans.”
Though private nonprofit colleges often cite low overall costs for low-income students after accounting for institutional aid, actual costs of college are far higher than at public institutions; students whose families make less than $30,000 pay about $17,500 per year at private four-year colleges. The 58 private colleges that enroll non-representative populations of Black students are able to charge about $2,400 less per year to the lowest-income students, further illustrating how this sector is not providing access to Black students equitably.[26]
The inequities in college access and affordability are heightened by the disproportionate number of Black students enrolled in for-profit institutions, which tend to have the highest costs of any sector. At Illinois’ for-profit institutions, the net price for a student whose family makes less than $30,000 is about $22,000 per year.[27] There are many rational reasons students choose these institutions, despite the far higher cost, including marketing efforts, promised job placement, flexibility, ease of access, and responsiveness.[28]
Like many Black Illinoisans facing family and/or financial issues, one interviewed student enrolled in an institution accessible from her home to enhance her skills and secure a better paying job. “My mom got really sick, so I went back home for a couple of semesters and while I lived back home I went to [for-profit college] and I got my pharm tech [pharmacy technician] certification, so I can work as a pharm tech while I was in school, and to help get ready for pharmacy school. When I returned to [the public university], I kind of got discouraged because I was trying to get a pharm tech job and no one really wanted to hire me.” She didn’t know that this institution was a for-profit college, and was surprised when employers didn’t value her credential, though that is often the case with institutions from this sector.[29] The price of this program is listed at $23,000 (compared to the $15,600 average cost of her university), and the for-profit college she attended has four times the rate of students defaulting on loans compared to her public university.[30] Attending the for-profit institution also put this student at risk of exhausting financial aid eligibility, which is limited by the number of semesters a student spends in college. Finally, it affected her ambition to become a pharmacist. After finding her pharmacy credentials weren’t valued in the job market, she decided to switch majors.
Opportunity Cost
College is often spoken of as an investment. However, unlike putting savings in the stock market, the decision to spend one’s time attending college comes at the direct expense of making money, unless a student has wealth or the ability to take on debt with little consequence. This trade-off, commonly referred to as opportunity cost, can be hard to observe. However, when asked directly, surveyed Black college students put much greater value on having resources now rather than in a year.[31] This can be the unseen cause of access issues, as students forgo college opportunities with better long-term payoffs for ones that offer short-term returns, lower costs, and/or less debt.[32] Having less money in the bank means a student is essentially paying far more for every hour they are in a classroom instead of working.
Opportunity cost may be apparent in Black students’ work trends. Of surveyed Illinois working students, 81% of Black students worked more than 20 hours per week, compared to 71% of White students, and 60% of Illinois’ Black students said their jobs limit the number of classes they could take, compared to just 47% of White students.[33] A greater need to work may help explain the extra year the median Black student takes to graduate compared to White students.[34] Opportunity cost is also a major factor in more students enrolling in community colleges during recessions, as job opportunities are scarcer. This was reflected in Black student enrollment growth in Illinois during the latest recession. This growth was an opportunity for the state to improve the educational attainment and employment prospects of workers, but Black graduation rates dipped to a a 12-year low, unfortunately signaling affordability and other institutional challenges for this influx of students.[35] Encouraging students to complete degrees and then supporting them as they do so, perhaps through targeted grant programs, can help students finish while increasing the state’s educated workforce.
Policy Recommendations to Decrease the Cost of a Degree
- Better fund public institutuions
- Eliminate MAP at for-profit institutions
- Offer completion grants
For details on each recommendation, see the Decreasing the Cost of a Degree section.
Part 3: Ability to Pay
The greatest affordability gaps are in the different resources that Illinois Black and White students have to pay for college. This is apparent by household income, but is most evident in wealth disparities, as Black students start with very thin margins for discretionary spending compared to White students.
Loans are often necessary to cover the previously outlined costs, but Black students in Illinois end up owing more than any other racial group, and default at higher rates. “A lot of people would tell me, ‘Hey, don’t worry about loans because going to college, it’s worth it,’” said a public university student. “‘Once you go to college, you get that degree, you’re going to be making the money you need to make to pay back those loans.’”
As college costs rise, Black students have been increasingly less able to rely on state aid to cover the difference. One year the aforementioned student had to take out more in loans because she was MAP suspended, meaning she was denied a grant when the state’s funding came up short. Unfortunately, like many students, she blamed herself for being denied aid, despite being eligible and applying for it: “I think in my sophomore or junior year, I filled it out later, so I didn’t qualify for MAP. That was on me.”
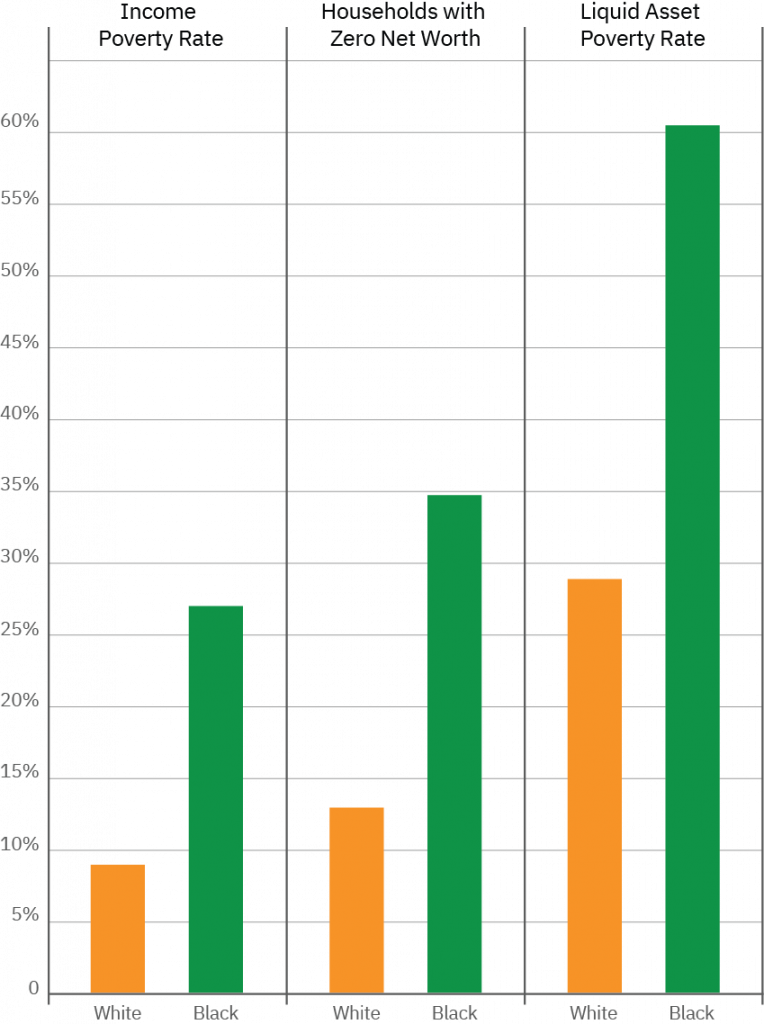
Black Illinoisans have greater rates of wealth and income poverty
Income Gaps
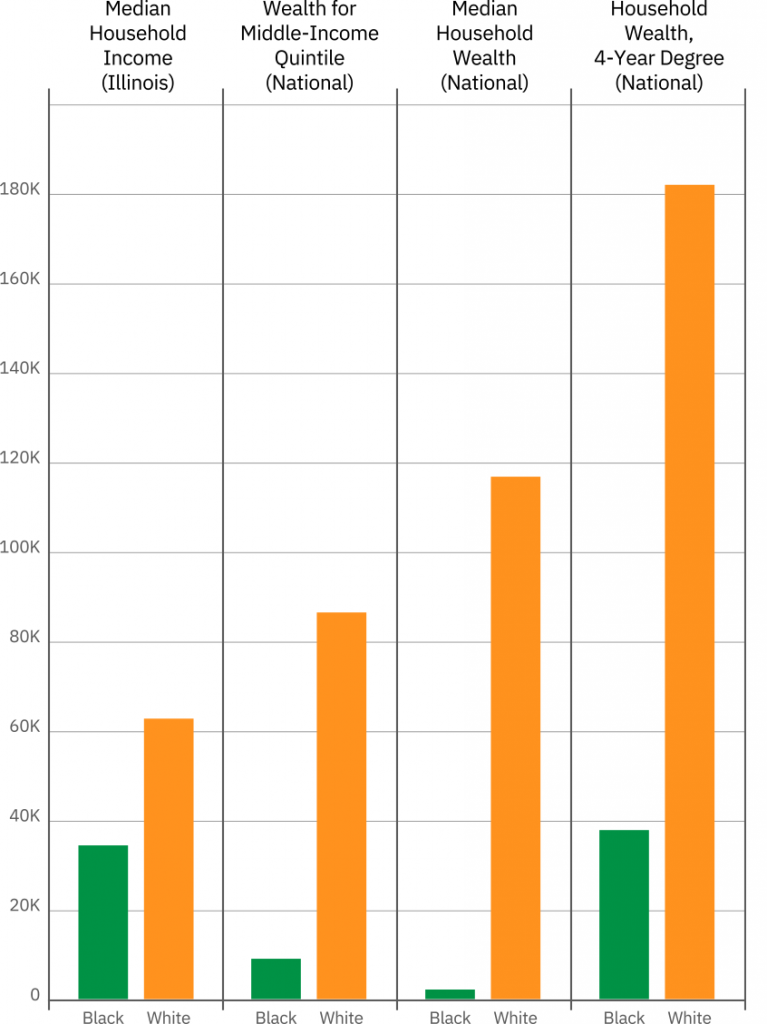
Typically, household income is used as a measurement of a family’s ability to pay for college. In Illinois, the median Black household earns $33,500, compared to $62,00 for White households, and is three times more likely to have an annual income below federal poverty levels.[36] Survey data shows that there are even greater income gaps among White and Black households sending students to college in Illinois. [37] Because of income disparities, Illinois Black families pay 44% of their income to attend public universities and 51% to attend private colleges, compared to 31% and 35% for White students, respectively. Gaps are even larger at public two-year colleges, with Black Illinoisans paying about double the percentage of their income compared to White Illinoisans.[38]
Wealth Disparities
Though income is important, a family’s wealth, both in a more liquid form (like a savings account) or non-liquid (such as housing) provides resources and stability that are crucial in persisting through years of college expenses. Racial wealth gaps have been formed over generations of discriminatory policies that made assets, especially housing, easier for White families to accumulate, and in Illinois these gaps are significant. The median Black family in America has about $11,000 in wealth, compared to $134,000 for White families, and in Illinois the median White family has a higher net worth than the national average.[39] This considers durable goods like cars and furniture, which cannot be directly used to fund college; without durable goods, the median White family in America has 75 times the wealth of the average Black family.[40] In Illinois, 61% of Black families live in liquid asset poverty, meaning that their savings can’t cover three months of basic expenses, compared to only 28% of White families.[41] Discussions of students’ ability to pay for college often overlook race and simply focus on income, but these differences in wealth show how inaccurate that measure can be. For example, the typical Black family with a middle-class income has just $10,000 more wealth than a White family with one-third of their income, whereas the typical White family with a middle-class income would have $120,000 more.[42]
Racial wealth gaps threaten college completion in many ways. First, studies show Black students are especially likely to experience disruptive major life events. [43] However, the parents of Black college students are less likely to have the financial resources to save for emergencies, or to be able to help with tuition.[44] The connection between race, wealth, and college persistence was apparent in a study of student loans and college persistence, which showed White students were significantly more likely to graduate than Black students, but controlling for household net wealth diminished this effect.[45]
Taking on and Paying off Debt
“If [taking out loans] was something that I really needed to do, I would definitely do it… but if [I could] keep struggling and be done without [loans], I would keep struggling and be done with it,” said one student who ramped up to working more than 20 hours per week and turned down unpaid internships to minimize loans.
In lieu of wealth, the ability and willingness to take on debt can determine if students have the resources to persist in college. Black students and their families take on more debt per borrower than any group in Illinois, and that debt is both riskier and harder to pay off, as further described in the Payoff section. Among surveyed Illinois students, 38% of Black graduates owed more than $15,000 in debt, compared to 23% of White students, and gaps are equally large regardless of whether a student completed college.[46] Mounting debt can cause students to stop out before finishing; nationally, about 70% of Black students who stopped out cited student loans as a primary reason, as opposed to less than half of White students. [47] This issue is particularly prevalent in Illinois, which ranks 12th in percentage of public and private nonprofit college students who have debt.[48]
There are significant wealth and income gaps between Black and White households
The kind of debt Black students are taking on is also of concern. National research shows that Direct Parent PLUS (DPP) loans have grown as a source of college funding for low-income Black students over the last decade.[49] DPP loans offer dependent students’ parents up to $5,000 per year at higher interest rates than undergraduate or graduate federal loans. These types of loans can burden two generations with mounting and especially risky debt for decades to come; thus, they have troubling implications for the prospects of building generational wealth.[50] In Illinois, the number of DPP loans has doubled in the last decade. In 2007, 15,000 students in Illinois borrowed about $180 million in DPP loans, compared to about 34,000 students totaling $500 million in 2018. [51] As one interviewed student put it, “If loans are in my name, that’s totally fine – it’ll get paid off. I feel like it’s kind of unfair to put any in your parents’ names. They have nothing to do with what you’re doing, so it’s just a bad investment on their end.”
Private loans with high interest rates, too, are problematic for Black students. Among Illinois undergraduates surveyed in 2008, 15% of Black students had both private and public loans, compared to just 9% of White students, and Black students were three times more likely to pay high interest rates on private loans.[52] Like Parent PLUS loans, private loans have recently started requiring nearly all students to have co-signers, making their use among Black students and their families another issue of concern.[53]
Default rates and amounts are highest at for-profit institutions, which Black Illinoisans disproportionately attend. On average, 23% of students in Illinois for-profit colleges default on student loans within four years, and those who default do so with an average of $15,000.[54] For-profit sector outcomes are often compared to community colleges, but in Illinois students at the public two-year colleges default at a lower rate, and those defaulting do so with an average of less than $5,000.
Borrowing allows students without wealth to attend and persist in expensive institutions, but Black students are borrowing more and in riskier ways than White students. If nothing is done to make college more affordable, substantial debt will further burden generations of students and their families and threaten the economic future of Black Illinoisans in untold ways, further exacerbating racial inequities in wealth.
Policy Recommendations to Increase Students’ Ability to Pay
- Increase state investment in the Monetary Award Program
- Eliminate or reform merit-based aid
For details on each recommendation, see the Increasing Students’ Ability to Pay section.
State and Federal Aid
Federal and state aid are meant to make up most of the differences between a college’s cost and what a family can afford to pay, and this is especially important in Illinois, which has large racial disparities in expected family contribution (EFC).[55] In Illinois, the average EFC is $3,600 for Black families, compared to $11,500 for White families. [56] However, state aid has become less reliable and meaningful after nearly two decades of disinvestment. This has turned the state’s Monetary Award Program (MAP) into a first-come-first-served grant that in Fiscal Year 2018 denied awards to nearly 100,000 qualified students, and for those that did receive funding, it only covered about one-third of tuition and fees at four-year colleges and universities.[57] Because Black students are more likely to be low-income, aid shortages disproportionately affect them. Further, until the RISE Act passed in 2019, MAP grants were limited in their coverage of developmental education courses, and as previously mentioned, Black students are disproportionately placed in these courses. [58]
Worse, in Fiscal Year 2016 and Fiscal Year 2017, the State of Illinois operated without a budget, turning persistent state aid shortages into a dire situation, as colleges couldn’t ensure the state would provide these funds to students. Notably, many colleges and universities guaranteed this funding to students during the impasse. However, in an ISAC survey during one of the delays in MAP funding, about half of respondents said that this funding uncertainty affected their educational goals, hundreds reported dropping out of school because of it, and about half said that they increased working hours and/or decreased credits taken to make up for this funding loss.[59] One student interviewed for this report said that his choice to attend private college was related to his lack of trust in the ability of public universities to maintain aid throughout tumultuous times, informed by a family member’s bad experience. “My brother had to leave because he didn’t get his financial aid. It just didn’t kick in, so he had to come out of class, and then we had to go pick up all his stuff. It was really bad. It was like he was getting kicked out.” Sudden changes in costs can cause students to discontinue their education, and unfortunately MAP shortcomings make this an annual risk for tens of thousands of Black students in Illinois.[60]

Payoffs of a Degree
“The motivation for me to go to college was to end the cycle of poverty with me,” said one student, who was working hard to not take out more in loans than the $75,000 she estimated she would make per year after graduating. “Some of my friends studied abroad and traveled and did all that, and I wish I could’ve done that, but I just went straight to college… and I would love to own a house and own a car because my family, we don’t have a car. [I value] having financial stability and being able to plan for retirement, and all of that.”
Earning a college degree is often assumed to have certain universal economic payoffs for the graduate, such as steady employment, a lifetime pass into middle class earnings, and a comfortable level of wealth for future generations. Indeed, a degree is transformative financially, as Black college graduates boost their earnings by 67% over a high school diploma.[61] However, research and data also show that the payoff of a college degree is not the same for Black and White Illinoisans. This itself is an important issue, but it can also have negative effects on completion, as Black students can see unequal outcomes and, when combined with high costs, longer trajectories, and greater hardship, it can change students’ motivation to enroll and persist.
Employment and Income Disparities
Nationally, Black bachelor’s degree graduates make 20% less over their lifetime than White graduates, and the payoff on an associate’s, master’s, or doctorate degree is less for Black students than any other race or ethnicity.[62] It is also harder for Black graduates to find jobs in general, as far greater percentages of Black graduates are unemployed and underemployed, relative to White graduates, and Black graduates are also more likely to have long spells of unemployment after college.[63] This may also be related to discrimination in the labor market and other socioeconomic factors that should be examined further, but fixing inequities in higher education are an essential part of counteracting these statistics.
Future Wealth and Debt
The differences in wealth among Black and White college graduates show that while a degree greatly increases a graduate’s earning power, it does little to close the wealth gap. The median wealth of Black college graduates is $38,000, compared to the $181,000 for White 4-year degree earners.[64] This is perpetuated by the large amount of debt Black students take on; a recent study found that 12 years after college, the typical White student owed 65% of their original student loan amount, but Black students actually owed more than their original amount, and this was true whether they completed a degree or not.[65] Black student borrowers are also three times more likely to default on student loans than White students, and this remains true even when only looking at college graduates.[66]
In Illinois, Black student enrollment in for-profit colleges, which are associated with high borrowing rates and marginally improved earnings, likely contributes to disparate borrowing outcomes.[67] However, there are also gaps in earnings and loan repayment that are unique to Black students within each sector. Students from non-representative public universities earn on average $47,700 per year ten years after enrolling, compared to $40,600 for representative public universities, and this gap is about twice as large for private colleges.[68] Further, private nonprofit colleges that have higher loan repayment rates enroll significantly fewer Black undergraduates. For example, a college with 10% Black enrollment is associated with three-quarters of its students paying down loans after seven years, compared to a college with 30% Black enrollment, which is associated with only 56% of students paying them off.[69] Differences in completion percentage do not explain these trends, as the correlation is strong looking separately at students who have completed, and those who have not completed.[70]
Having a large debt burden effects students’ future wealth in far-reaching ways, beyond just having to pay off that sum with interest. Demos’ At What Cost study estimates that taking $53,000 in debt (average for a household with two bachelor’s degrees) is equivalent to a loss of $208,000 in lifetime wealth.[71] This wealth loss mainly takes the form of less retirement savings and home equity, two staples of socioeconomic stability. Further research estimates that every additional $1,000 of student loan debt is associated with about 2% lower likelihood that that person will own a home (and Black Illinois four-year graduates have $8,000 more federal loan debt on average than their White counterparts).[72] Racial wealth gaps have been getting worse over time, as well – from 1989 to 2013 White college-educated households gained $31,000 of total wealth and Black college-educated households lost $20,000.[73]
The American dream of college attainment is multigenerational, with middle class jobs and income more assured to the children of college graduates. Illinois data shows, however, that Black graduates are less able to pass on the positive effects of college attainment to their children. Black children born into middle-class income in Illinois have a 34% chance of getting a college degree, compared to 45% for White children from the same income quintile.[74]
Conclusion
The number of Black college graduates in Illinois has been decreasing since 2011, and if it follows projections of Black high school graduates, the number of college graduates is poised to decline further. Black students continue to pay, borrow, and work significantly more to afford college, which speaks to the drive and hard work of thousands of students seeking the opportunity a college degree can provide. However, access and completion gaps have been maintained by persistent, and in many cases growing affordability barriers.
Black students disproportionately attend for-profit colleges, which are often more accessible, but see subpar or negative outcomes. Black students need more affordable access to the state’s four-year colleges and universities, and this must include more selective colleges, as they often have greater resources and post-college payoffs. Further, the state must equitably fund institutions serving greater numbers of Black students. Bringing equity to higher education funding is essential, but the state also must limit barriers like developmental education and improve its transfer pipeline to ensure affordable pathways turn into good opportunities.
This is not just a moral imperative for Illinois, it is also an economic one, as Illinois’ economy is already suffering from inequality in its educated workforce.[75]
References
1. “Illinois Board of Higher Education. “Table I-2: Total Fall Enrollments by Gender, Race or National Origin, and Type of Institution, and Level of Instruction Fall 2017.” Illinois Board of Higher Education. Accessed July 31, 2019. and “Data — Knocking at the College Door.” and WICHE Projections of High School Graduates. Accessed July 29, 2019.
2. “Ibid.
3. Illinois Board of Higher Education, “Table I-2: Total Fall Enrollments by Gender, Race or National Origin, and Type of Institution, and Level of Instruction Fall 2017.”
4. “Annual Enrollment and Completion Data.” ICCB, 2017. Table III-4 for enrollment and “Annual Enrollment and Completion Data.” ICCB, 2019.
5. “Chapter I & Table I-12.” IBHE Databook, Fall 2017. Black students make up about 14% of 2016 community college enrollees, but only 10% of Illinois’ completions and transfers to public universities. This is despite Black Illinois community college students being more likely than White students to cite preparing to transfer as their primary reason for enrolling in community college. “NCES PowerStats.”
6. Data provided by the Illinois Community College Board (ICCB)
7. “Table I-3: Race or National Origin of Students Enrolled in Illinois Colleges and Universities by Type of Institution.” Illinois Board of Higher Education, Fall 2017.
8. “Policy Brief: Remediation Reform.” Partnership for College Completion, March 2019.
9. U.S. Department of Education. “College Scorecard Data.” College Scorecard, May 21, 2019.
10. Cohort data from “Separate and Unequal: How Higher Education Reinforces the Intergenerational Reproduction of White Racial Privilege.” National Center for Education Statistics. Accessed July 31, 2019.
11. Data provided by the Illinois Student Assistance Commission (ISAC)
12. Carnevale, Anthony P., and Jeff Strohl. “Separate and Unequal: How Higher Education Reinforces the Intergenerational Reproduction of White Racial Privilege.” Georgetown Center for Education and the Workforce, July 2013. U.S. Department of Education. “College Scorecard Data.” College Scorecard, May 21, 2019.
13. Data provided by Cappex and College Greenlight. While not necessarily representative of the state, the data includes more than 3,600 private college inquiries from Black students in one year, showing substantial interest in this sector.
14. Carnevale and Strohl, “Separate and Unequal: How Higher Education Reinforces the Intergenerational Reproduction of White Racial Privilege.”
15. Kmetz, Danika. “UChicago Launches Test-Optional Admissions Process with Expanded Financial Aid, Scholarships.” University of Chicago News, June 14, 2018.
16. U.S. Department of Education, “College Scorecard Data.”
17. Data provided by Cappex and College Greenlight. Black students’ college inquiries are strongly correlated with Black completion rates at those colleges, but not at all correlated with the percent of Black students enrolled at that college
18. Illinois Board of Higher Education, “Table I-2: Total Fall Enrollments by Gender, Race or National Origin, and Type of Institution, and Level of Instruction Fall 2017.”
19. Deming, David J., Claudia Goldin, and Lawrence F. Katz. “The For-Profit Postsecondary School Sector: Nimble Critters or Agile Predators?” Journal of Economic Perspectives 26, no. 1 (February 2012): 139–64.
20. Hoxby, Caroline M., and Christopher Avery. “The Missing ‘One-Offs’: The Hidden Supply of High-Achieving, Low-Income Students.” Brookings Papers on Economic Activity (blog), March 21, 2013. and Lowry, Kimberly M. “Community College Choice and the Role of Undermatching in the Lives of African Americans,” 2017.
21. U.S. Department of Education, “College Scorecard Data.” and data from College Greenlight and Cappex
22. “Variation in Published Prices for Trends in College Pricing – Trends in Higher Education.” The College Board. Accessed August 14, 2019.
23. U.S. Department of Education, “College Scorecard Data.”
24. Bureau, U. S. Census. “American FactFinder.” Accessed May 24, 2019.
25. “The Integrated Postsecondary Education Data System.” This uses the NCES definition of the Great Lakes region., which includes Illinois, Indiana, Michigan, Ohio, and Wisconsin.
26. Ibid.
27. Ibid.
28. Holland, Megan M., and Stefanie DeLuca. “‘Why Wait Years to Become Something?’ Low-Income African American Youth and the Costly Career Search in For-Profit Trade Schools.” Sociology of Education 89, no. 4 (September 15, 2016): 261–78.
29. Deming, David J., Noam Yuchtman, Amira Abulafi, Claudia Goldin, and Lawrence F. Katz. “The Value of Postsecondary Credentials in the Labor Market: An Experimental Study.” American Economic Review 106, no. 3 (March 2016): 778–806.
30. Miller, Ben. “How You Can See Your College’s Long-Term Default Rate.” Center for American Progress, August 30, 2018.
31. “National Postsecondary Student Aid Study: 2016 Undergraduates.” National Center for Education Statistics. Accessed July 31, 2019.
32. Wescher, Lance, Travis Hutchinson, and Anna Rannou. “Minimum Wages, Employment, and College Enrollment.” The American Economist 64, no. 1 (2019): 3–18.
33. “National Postsecondary Student Aid Study: 2008 Undergraduates.” National Center for Education Statistics. Accessed July 31, 2019. This report uses the National Postsecondary Student Aid Study from 2008, the latest year for which Illinois-specific data is available. However, as noted throughout this report, the recession has only exacerbated the enrollment , wealth, and debt issues that Black students face.
34. Ibid.
35. “Trend Generator: Graduation and Retention Rates.” National Center for Education Statistics. Accessed July 31, 2019.
36. “Financial Insecurity in Chicago: A Data Profile.” Family Assets Count. Prosperity Now, June 2015.
37. “NCES PowerStats.” NPSAS:08
38. Ibid.
39. Asante-Muhammad, Dedrick, Chuck Collins, Josh Hoxie, and Emanuel Nieves. “The Road to Zero Wealth.” Prosperity Now, September 2017. “Financial Insecurity in Chicago: A Data Profile.”
40. Ibid.
41. “Prosperity Now Scorecard Data By Location.” Prosperity Now. Accessed May 28, 2019.
42. Middle income defined as $61,000 to $104,000 Asante-Muhammad et al., “The Road to Zero Wealth.”
43. Turner, R. Jay, and William R. Avison. “Status Variations in Stress Exposure: Implications for the Interpretation of Research on Race, Socioeconomic Status, and Gender.” Journal of Health and Social Behavior 44, no. 4 (2003): 488–505.
44. “NCES PowerStats.”NPSAS:08
45. Zhan, Min. “The Impact of Youth Debt on College Graduation.” Journal of Sociology and Social Welfare 41 (January 2014).
46. “NCES PowerStats.”NPSAS:08
47. Johnson, Anne, Tobin Van Ostern, and Abraham White. “The Student Debt Crisis.” Campus Progress, October 25, 2012.
48. “State by State Data.” The Institute For College Access and Success. Accessed August 6, 2019.
49. Fishman, Rachel. “The Wealth Gap PLUS Debt: Part I: Intergenerational Higher Education Debt.” New America, May 15, 2018.
50. Ibid.
51. “Title IV Program Volume Reports.” Federal Student Aid. Accessed August 14, 2019.
52. “NCES PowerStats.” NPSAS:08
53. Consumer Financial Protection Bureau. “Private Student Loans,” August 29, 2012.
54. Miller, “How You Can See Your College’s Long-Term Default Rate.”
55. The EFC formula takes into account dependency status; taxed and untaxed income, assets, and benefits of the student’s family (i.e. unemployment, social security, etc.); family size; and the number of family members who will attend college or trade school during the year.
56. “NCES PowerStats.” NPSAS:08
57. “Basic ISAC Program Data.” Illinois Student Assistance Commission, December 2018.
58. “Policy Brief: Remediation Reform.” The Retention of Illinois Students Equity (RISE) Act, passed in May 2019, expands eligibility for state need-based financial aid to undocumented students, transgender students who have not registered for Selective Service, and students who fall under a 75-credit-hour maximum for aid from the state. “Illinois General Assembly – Full Text of HB2691.” Accessed October 4, 2019.
59. “FY17 MAP Grant Survey: What Is the Impact on Students?” ISAC Research Brief, December 2016.
60. Conger, Dylan, and Lesley J. Turner. “The Effect of Price Shocks on Undocumented Students’ College Attainment and Completion.” Journal of Public Economics 148 (April 1, 2017): 92–114.
61. Carnevale, Anthony P., Jeff Strohl, Martin Van Der Werf, Michael C. Quinn, and Dmitri Repnikov. “Separate and Unequal: How Higher Education Reinforces the Intergenerational Reproduction of White Racial Privilege.” Georgetown Center for Education and the Workforce, 2018.
62. Carnevale, Anthony P., Stephen J. Rose, and Ban Cheah. “The College Payoff.” Georgetown University: Center on Education and the Workplace, n.d. National Center for Educational Statistics. “The Condition of Education 2016.” National Center for Education Statistics, May 2016. This is true regardless of the field of work.
63. “Baccalaureate and Beyond: 2008/2012.” National Center for Education Statistics. Accessed July 31, 2019. Gould, Elise, Zane Mokhiber, and Julia Wolfe. “Class of 2018: College Edition.” Economic Policy Institute (blog), May 10, 2018.
64. Asante-Muhammad et al., “The Road to Zero Wealth.”
65. Miller, Ben. “New Federal Data Show a Student Loan Crisis for African American Borrowers.” Center for American Progress, October 16, 2017.
66. Scott-Clayton, Judith. “What Accounts for Gaps in Student Loan Default, and What Happens After.” Brookings (blog), June 21, 2018. And Li, Jing, and Judith Scott-Clayton. “Black-White Disparity in Student Loan Debt More than Triples after Graduation.” Brookings (blog), October 20, 2016.
67. Gelbgiser, Dafna. “College for All, Degrees for Few: For-Profit Colleges and Socioeconomic Differences in Degree Attainment.” Social Forces 96, no. 4 (April 11, 2018): 1785–1824.
68. U.S. Department of Education, “College Scorecard Data.”
69. Ibid.
70. Ibid.
71. Hiltonsmith, Robert. “At What Cost? How Student Debt Reduces Lifetime Wealth.” Demos, August 7, 2013.
72. Mezza, Alvaro, Daniel Ringo, Shane Sherlund, and Kamila Sommer. “Student Loans and Homeownership.” Journal of Labor Economics, May 23, 2019. and “NCES PowerStats.” NPSAS:08
73. “Racial Wealth and Economic Equity.” Institute on Assets and Social Policy. Accessed August 7, 2019.“
74. Data Library.” Opportunity Insights (blog). Accessed May 30, 2019.
75. “Inclusive Growth – On to 2050 Strategy Paper.” Chicago Metropolitan Agency for Planning, July 2017.