Adequately funding public higher education should be seen as necessary to increasing college access, promoting student success, and improving the state’s regional competitiveness.
Executive Summary
Illinois has a robust system of public higher education. However, after a series of challenges (e.g., economic recessions, the global COVID-19 pandemic, and rapid inflation), public universities in Illinois are having to do more with less. Public universities in Illinois must increase enrollment and improve student success, but in 2021, the state’s allocations to public universities only had about half the purchasing power that they did in 2002.1 At present, Illinois has an opportunity to financially recommit to its goal of awarding a postsecondary credential to 60% of working-age state residents.2 Adequately funding public higher education should be seen as necessary to increasing college access, promoting student success, and improving the state’s regional competitiveness.
Figure 1. Decline in state appropriations and enrollment change, 2005-2021
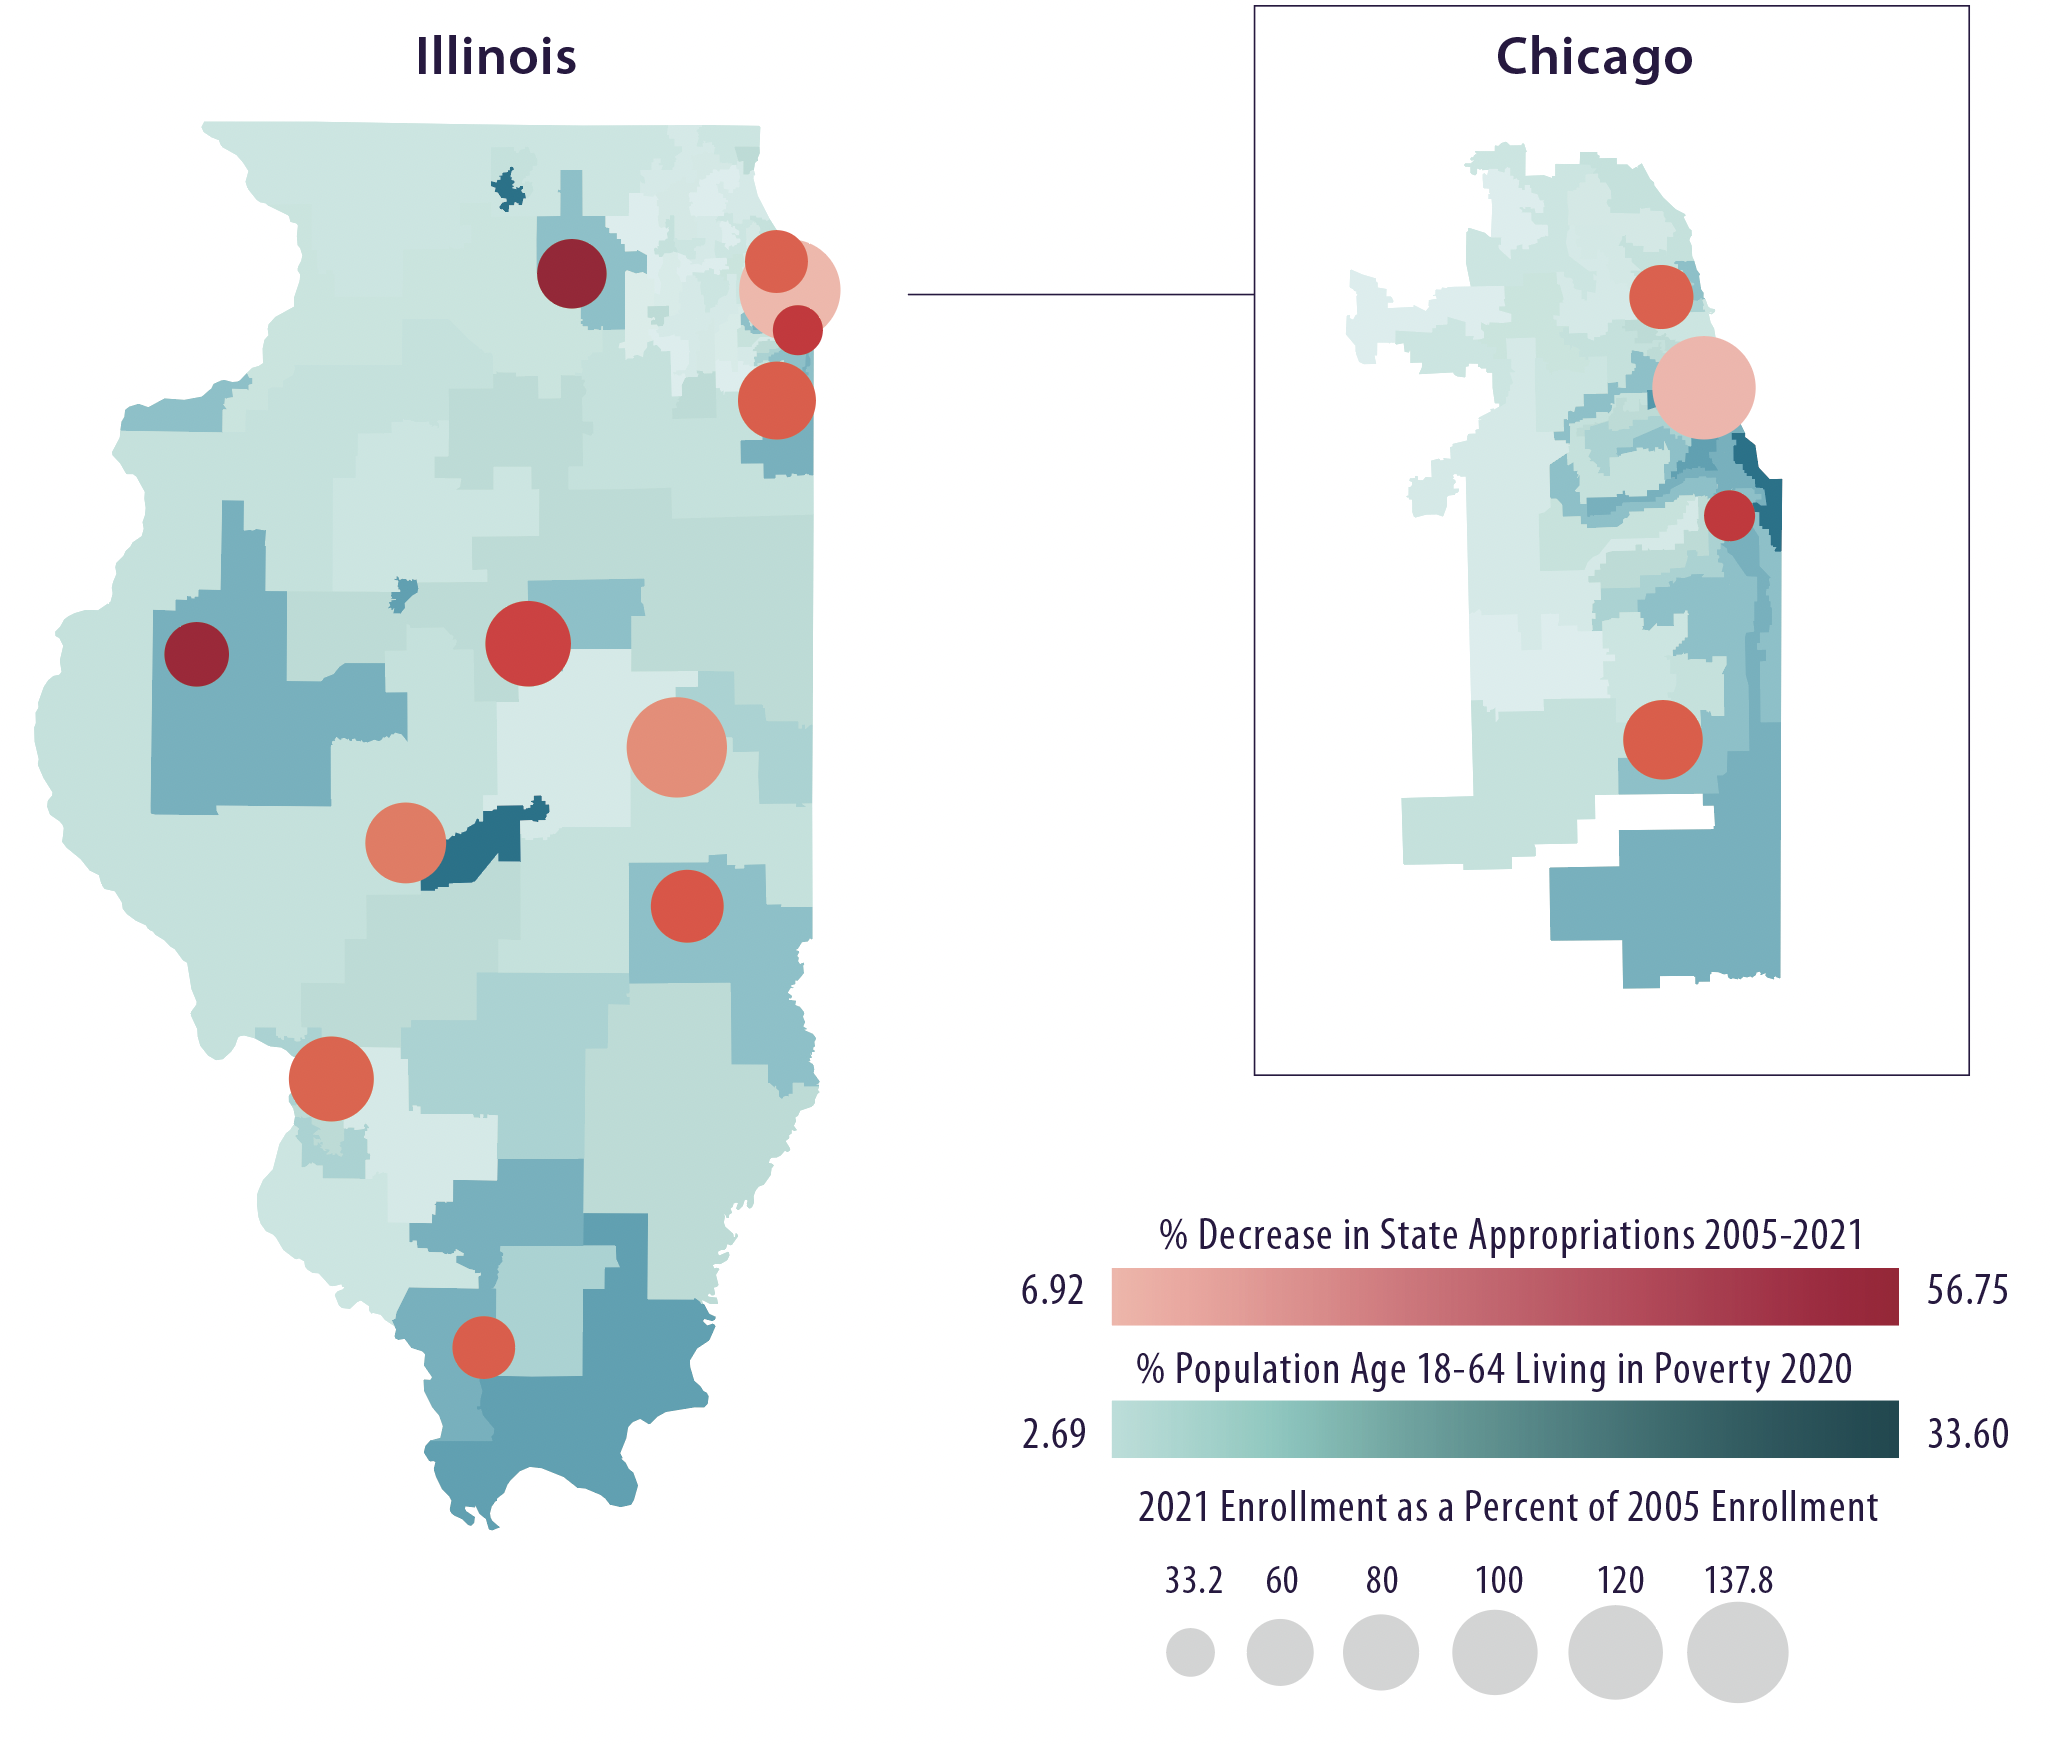
Inflation-adjusted appropriations decreased in Illinois between the 2017 and 2023 fiscal years by approximately 18%. In response, universities partially offset cuts by raising tuition and fees, even as higher education enrollment declined between 2013 and 2019. Students at most Illinois public universities paid a substantially higher net price than students at the research flagship campuses. Unlike the flagship campuses, other public universities have been unable to offer substantial institutionally funded financial aid to make college affordable. Although the gap narrowed by 2020, students were still paying more to attend less research-intensive universities that were meant to be affordable and accessible.
Illinois universities need funding to provide instructional opportunities and wraparound student services to retain students from enrollment through graduation. Inadequate funding results in declining student retention. For instance, four-year public universities failed to retain one-third of Black students for even one year after they initially enrolled. After six years, four-year public universities failed to graduate more than 60% of Black first-year college students.3 At present, there are significant gaps in how much Illinois public universities spend on both instruction and support services.
When students do graduate, the high cost of an Illinois public higher education continues to impede their success. Other than students who attend University of Illinois at Urbana-Champaign, students who attend less research-intensive public universities in the state leave with greater student loan debt, on average, than their counterparts in neighboring states. But the high cost of Illinois public higher education is especially challenging for students who enroll but do not graduate. Non-completing students, who are more likely to be traditionally underserved, were, on average, more negatively impacted by heavy student loans.4
Ultimately, Illinois policymakers must consider whether the state’s system of public higher education should be sufficiently funded to foster social mobility. In Illinois, students’ chances of getting ahead in life are tied to which state school they attend. To the extent that students attend the nearest school, their life chances are constrained by where they are born in the state. Just as students have access to wildly different amounts of academic and student support services depending on which public university they attend, so too does their opportunity to move into the middle or upper class vary according to which institution they attend.
Illinois will need to move toward adequately funding public universities to provide an equitable college education and to remain competitive in the 21st-century knowledge economy. At the end of this report, we draw on prior research and our new findings to provide recommendations for adequately funding public higher education in Illinois. Although we do not conclude with a specific funding formula, we hope this report will help policymakers, interest groups, and advocates as they set priorities and choose funding criteria for state support.

Section I Policy Context
Unstable State Funding to Public Higher Education
Historically, state spending on higher education is unstable and unpredictable. Funding to public higher education is cut more deeply than other budget categories (e.g., K-12 education and healthcare) when state revenues decline. However, when the economy is strong, public colleges and universities tend to receive larger increases than other budget categories from the state government.5 During economic downturns, public colleges and universities experience major funding uncertainties due to multiple revenue instabilities (e.g., state funding, tuition from students, and gifts from donors). When the actual year-to-year state funding substantially deviates from expected state appropriations for higher education institutions, public colleges and universities subject to a high level of funding volatility must involuntarily reduce investment in student success.6 Even when public higher education experiences a budget windfall, this instability makes it impossible for colleges and universities to set stable, adequate levels of instructional and student support expenditures. On top of campus-level instability, states have significant cross-level variation in how colleges and universities absorb cuts and invest surpluses; over time, institutional strategies can result in significant variation in the levels of support to students across colleges within a single state.
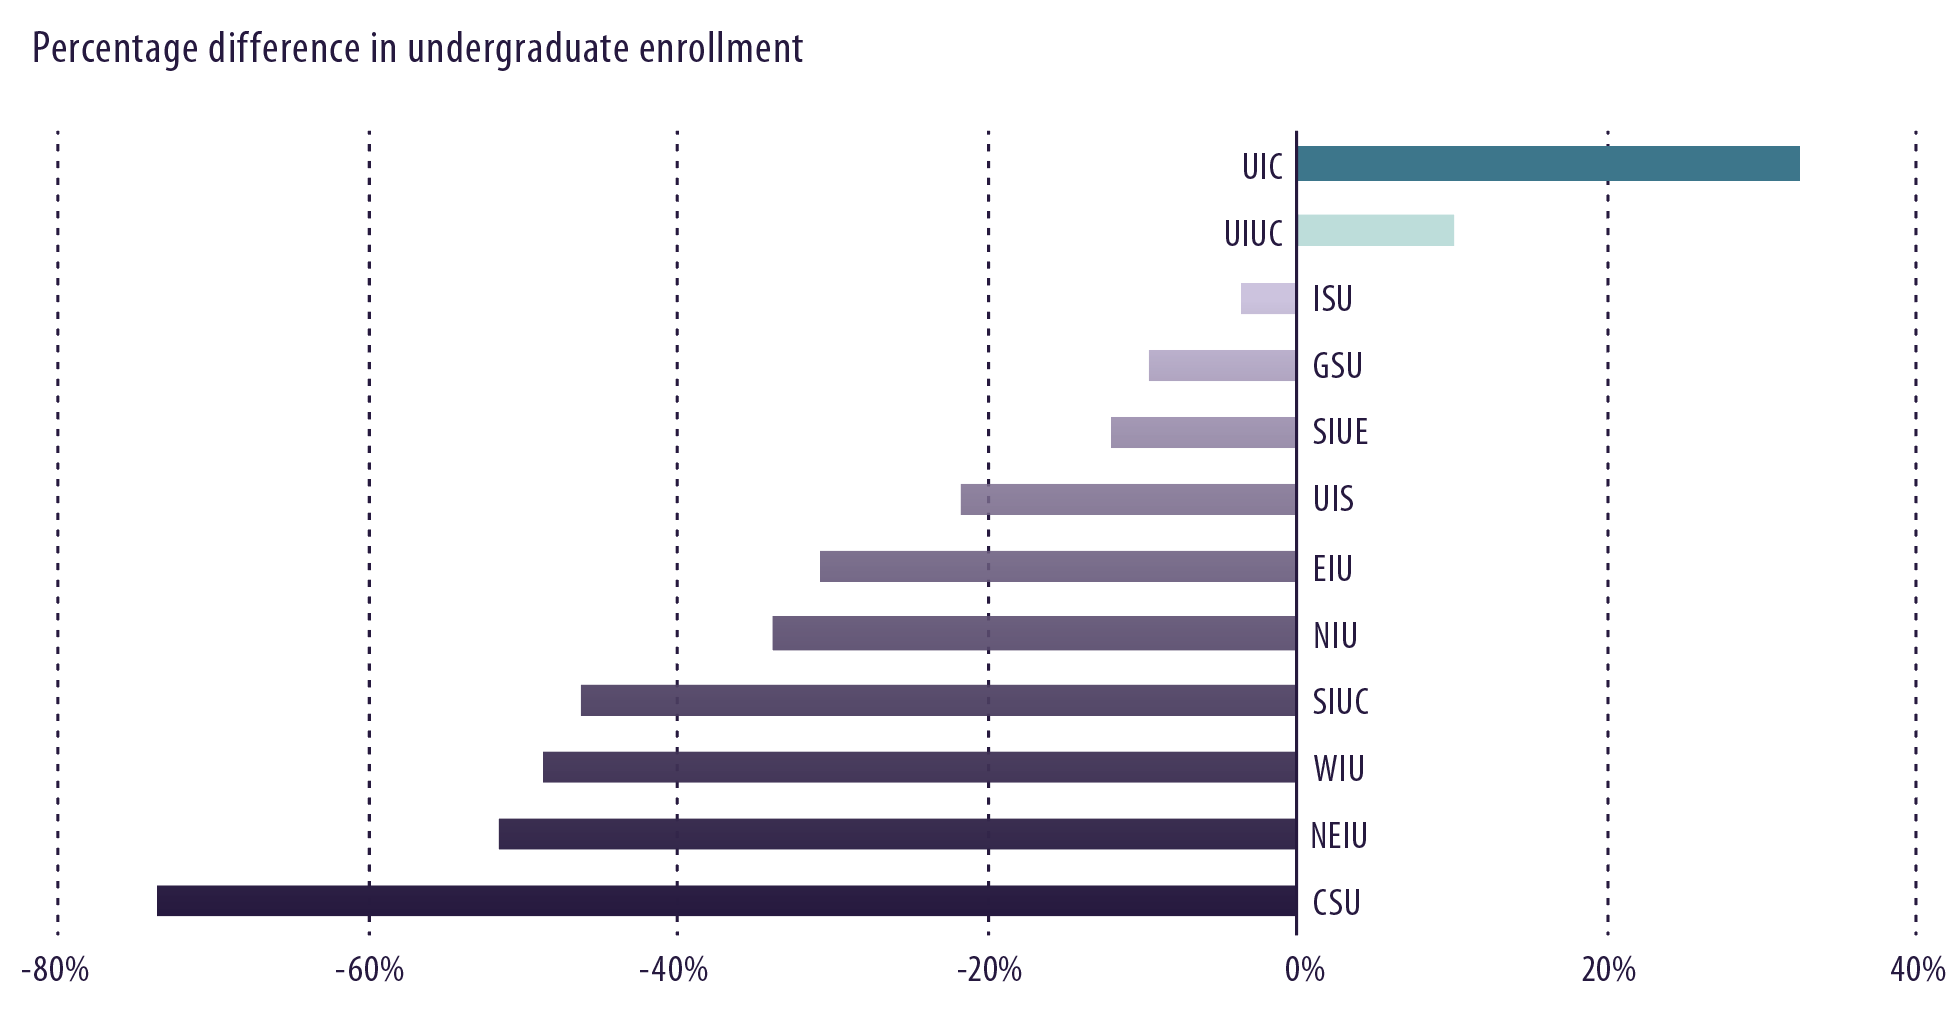
Figure 3: Changes in Undergraduate Headcount Enrollment at Illinois Public Universities, 2010-2020
Across the country, 2021 marked the ninth straight year of increase in education appropriations per full-time student. However, unlike other states, rising appropriations in Illinois are remarkable because as education appropriations increased, the share of appropriations used to fund pensions (including past unfunded liabilities) grew from 12% in 2009 to almost 42% in 2021. In 2021, states experienced the tenth straight year of national enrollment decline since the Great Recession.7 Amid these broader trends, improving student success remains a persistent problem. Since the Great Recession, four-year university retention rates increased modestly from 73.8% for all first-time students in 2009 to a high of 76.3% in 2019. When the pandemic started in 2020, that retention rate dropped to 75.4%.8 Retention rates are substantially lower among Hispanic (70.6%) and Black (64.7%) four-year college students.9
Due to the impact of the COVID-19 pandemic on state budgets and college and university revenues and expenditures, the federal government provided multiple phases of funding through the Higher Education Emergency Relief Fund (HEERF) in order to sustain instruction and student support.10 While relief funds have tremulously supported public colleges and universities, they did not address existing structural inequities and financial challenges in higher education.11 Given the projection of future losses in state and local appropriations, public colleges and universities continue to face instability and uncertainty pertaining to their governmental funding.12
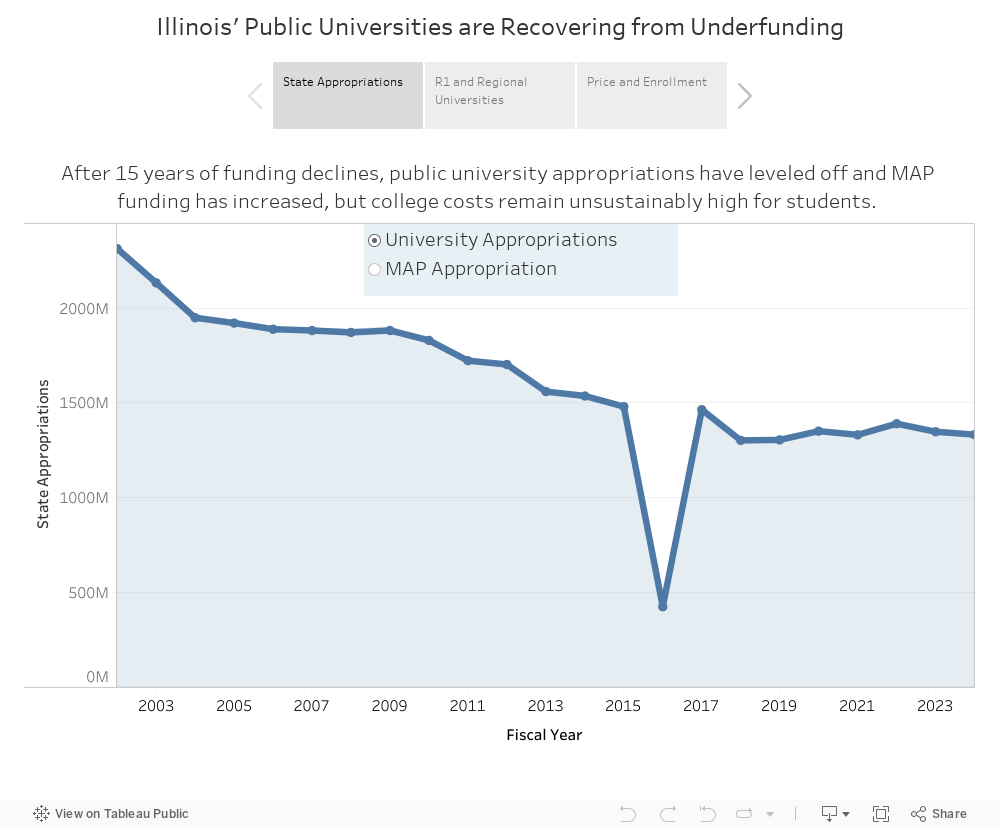
In the state of Illinois, annual state appropriations for public higher education have declined since 2017 when adjusted for inflation.13 In the first budget passed after the start of the COVID-19 pandemic, Illinois appeared to be doing well by maintaining rather than cutting public higher education funding, while the state’s general fund underwent significant cuts.14 Adjusted for inflation, the 2020 appropriation was a brief high point relative to the two preceding and subsequent budget cycles (see Tableau Viz above – State Appropriations). However, the cumulative effect of cuts in the longer term was that by 2021 the buying power of state allocations was only about half of what it was in 2002.15
Inadequate Funding and Student Vulnerability
Having established declining state support for colleges and universities, the question becomes: how does decreasing spending impact access and outcomes in higher education? When states cut spending to their public higher education systems, colleges only have two realistic short-term response options: cut spending or increase tuition. Sometimes they offset cuts by increasing tuition, but more often they reduce spending on instruction or student support services. According to Deming and Walters, as colleges cut spending, state disinvestment increases time to degree (students take longer to graduate) and reduces graduation rates (fewer students earn college degrees).16
Enrollment changes at public universities in Illinois varied drastically in the decade preceding the COVID-19 pandemic (see Figure 3). As the state cut funding in terms of real dollars, public universities increased tuition. Yet, because most institutions lost students, in many cases, inflation-adjusted tuition increases were still not enough to offset per-student cuts in state appropriations. For instance, at Illinois State University, appropriations per student declined by about $548 between the 2017 and 2022 Fiscal Years, while sticker price (tuition plus fees) increased by $1,955. Consider also that enrollment declined at Illinois State University by more than 500 students, or about 2.6%, between 2017 and 2022.
Although some campuses appear to have increasing appropriations per student, those figures are deceptive, a function of enrollment declines outpacing declining appropriations. Nearly all campuses or university systems raised the sticker price (the sum of tuition and fees) of attendance. If enrollment were increasing, raising tuition and fees would increase revenue, but enrollment is declining at most schools. Overall, campuses are becoming more reliant on tuition, even as they are losing enrollment and inflation-adjusted state support (as indicated in Figure 1). Funding inadequacy in Illinois is making its public universities increasingly vulnerable.
Meanwhile, colleges with varying changes in unduplicated headcount enrollment (whether declining, increasing, or steady) consistently made year-to-year adjustments in the ratio of instructional to student support expenditures in order to re-balance their budgets and absorb funding cuts.
Research shows that increasing spending (a) broadens access to higher education by increasing enrollment in both the current year and in future years and (b) supports success by giving institutions the resources to provide adequate course offerings and advising to help students graduate. Deming and Walters estimate that a large budget windfall (i.e., “a movement from the 25th to the 75th percentile” (p. 8) can increase current year enrollments by about 3%, future year enrollments by more than 1%, and the number of degree completions by up to 5% in the year following the increase in appropriations.17 The Deming and Walters findings are consistent with prior research, which estimates that increasing per-student expenditures by $1,000 “will yield a 1.09 percentage point increase in four-year graduation rates, about a 5% increase in the four-year rates.”18
Prior research illuminates how inadequate funding leads to poorer institutional outcomes. When colleges implement funding cuts, they offer fewer course sections. Students compete for more limited courses, which creates longer waitlists. If students are able to enroll in courses, those courses tend to have more students, which increases student to faculty ratios (reducing the amount of attention instructors can grant each student). Students also have less access to counselors or advisers, who could help them plan a course path to graduation.19
Declining funding for public higher education in Illinois undermines the state’s capacity to meet its stated goal, namely that 60% of working-age state residents earn a postsecondary credential by the year 2025.20 The 60 by 2025 Goal for Illinois mirrors other state and national completion goals. While Illinois reports an attainment rate of 55%, the overall rate disguises inequitable attainment among racial groups. White residents, who are the largest share of the state population, have a 52.8% attainment rate. Hispanic and Black residents make up the second and third largest shares of the population and have 22.5% and 31.7% attainment rates, respectively. Additionally, the overall attainment rate decreases to 47% when only college degrees, and not short-term certificates, are counted. In 2019, only about 38% of Illinois residents between the ages of 25 and 64 had attained a four-year degree or higher level of education.21 To help students and the state meet college completion goals, Illinois must provide adequate, stable funding to public colleges and universities.
Declining Resources and Institutional Vulnerability
How well states fund their colleges and universities impacts whether public higher education supports social mobility, or if it increases social stratification. For instance, the California State University system uniquely enables broad access for low-income students and supports student completion to achieve social mobility. Conversely, state flagship campuses that are highly selective and research-intensive can often have lower social mobility than the most selective private schools.22
The challenge is that as students and families have increased demand for higher education, states have decreased overall inflation-adjusted funding for public colleges and universities and concentrated limited resources at research-intensive flagship campuses. This has led to increased competition for scarce seats at state flagships, where, even when tuition is higher, students benefit from higher state subsidies relative to what they would get at less selective and less research-intensive campuses.23 In other words, state flagships offer high-quality educational opportunities relative to a student’s (or a student’s family’s) share of the cost of that education. By limiting overall spending and by concentrating resources at research-intensive flagship campuses, states have placed financial strain on students, their families, and less-research intensive colleges and universities. Taylor and Cantwell have documented that a decreasing number of colleges and universities receive adequate state support to invest in students’ education without increasing tuition and student borrowing.24
Well-funded state systems of public higher education are increasingly important, because many private institutions are not only expensive, they are so reliant on student tuition and loans to operate that they are “vulnerable” to closure if they do not meet enrollment goals.25 In fact, nearly 600 colleges (mostly private non-profit and for-profit) closed between 2017 and 2021.26 Yet, when states reduce funding to public colleges and universities, enrollments tend to shift to the for-profit higher education sector.27 States cannot rely on the private sector to offer a stable and accessible alternative that supports social mobility and meets workforce demands.

Section II Common but Problematic Policy Approaches to Funding Public Higher Education
Traditional Funding Models: Enrollment-Based Approach and Base-Plus Approach
State budgeting for higher education has been described as “an art, not a science” due to its complex process, cost structure, and diverse constituencies.28 One approach to meet budget requests from public colleges and universities is to allocate state funding based on the level of enrollment and the amount of resources needed.29 While the enrollment-based approach responds to changes in student enrollment with minimal decision-making from year to year, it does not incentivize educational outcomes beyond student matriculation.30 When public institutions seek additional funding from the state government, they have to prioritize enrollment, which may greatly fluctuate beyond the control of public colleges and universities. For states with an enrollment-based approach, state appropriations can be negatively influenced by the enrollment decline due to COVID-19.31
In Illinois, state appropriations to public four-year institutions generally have been distributed by means of a base-plus budgeting method.32 The level of state appropriations received by a given institution is based on its existing share of state funds rather than any standard or formula. This straightforward decision-making system carries low administrative costs. Though limited new funding can be justified by new expenditure items (e.g., new facility operations, new program requests), changes in enrollment, economic conditions, and demographic trends can be largely overlooked (or at least do not require direct response) under this approach.33 Rather, the most important factors in the base-plus approach are “general salary agreements and special/new proposals for program enhancement or quality improvement”.34 Ultimately determined by the Governor and the General Assembly, state appropriations to educational institutions are based on precedent and altered through negotiation when the political opportunity arises. Thus, due to varying levels of power among interest-groups and differing stakeholder preferences, this funding approach can also lead to inequitable funding allocation among colleges and universities as more influential and powerful universities benefit from a funding model that allows them to capture a disproportionately large share of state appropriations.35
Performance-Based Funding
With the objective of rewarding performance, many states have adopted performance-based funding (PBF) to replace historical base-plus models.36 Since their early prevalence in the 1990s, PBF policies have undergone constant changes in program existence, design, and implementation.37 Early PBF policies during the 1990s (now known as PBF 1.0) emphasized student-oriented measures (e.g., degree completion) with generally smaller proportions of funding awarded as bonus appropriations based on institutional performance. More recent PBF policies (known as PBF 2.0) use metrics to allocate base appropriations (rather than bonus funding) and account for institutional mission and student characteristics.38
For public four-year institutions in Illinois, a PBF policy was put in place in 2012 (Public Act 97-320) but it was only accounted for in the final appropriations in FY2013 and FY2014.39 This policy fits the description of PBF 2.0 because additional weight is given to graduates who are low-income, adult, Hispanic, Black, and major in STEM and Healthcare fields. While the policy included equity-minded metrics, it inherited a small percentage of funding (i.e., less than 1% of base funding), which is a feature of PBF 1.0.40 Because the appropriation was distributed between schools based on a share of total funds set aside for PBF, the 2011 PBF created a zero-sum internal competition model in that universities competed against each other rather than striving to advance institutional goals in their own contexts.41
Despite major investment in PBF to motivate institutional performance, current research largely concludes that PBF does not consistently lead to student success and institutional accountability.42 In particular, PBF policy adoption is not related to credential production, or is only positively associated with short-term credentials at public four-year institutions.43 Moreover, PBF has exacerbated the stratification of U.S. higher education by favoring already highly resourced institutions (e.g., research-intensive, highly selective institutions) while financially burdening low-resource institutions (e.g., non-research, non-highly selective institutions).44 For example, minority-serving institutions can be particularly disadvantaged by PBF because they serve a greater proportion of historically underrepresented students.45 PBF policy is also associated with reduced diversity in students’ racial and socioeconomic backgrounds at public four-year institutions, and this can be due to changing recruitment and retention efforts targeting academically high-performing students in order to achieve performance goals in exchange for state appropriations.46
Current research on PBF suggests that this funding incentive turns out to be ineffective at best. Nisar indicated that the failure of PBF can be attributed to the inherent complexity of the higher education system, in which institutional behaviors are not only driven by state appropriations but also by the broad and local context of PBF.47 To some extent, PBF 2.0 attempted to address the pitfalls of PBF 1.0 with larger incentives and mission-driven metrics. The concepts of funding accountability, adequacy, and equity have formed multiple sets of tradeoffs for higher education policymakers, as it remains highly challenging to achieve these three goals simultaneously. Colleges and universities have their own institutional impetus to pursue revenue, prestige, and enrollment.48 These internal motivations shape how public universities respond to external incentives imposed by the state government. PBF policies that do not tailor incentives to balance these elements inevitably fail: PBF tied to a small proportion of funding does not provide a strong enough incentive to influence institutional behaviors, as state appropriations are not the sole revenue source.49 PBF simply emphasizing graduation metrics does not drive authentic student success, as student learning takes time and it is more complex than degree attainment. PBF without equity indicators allows universities to remain selective and deprioritize students from underrepresented backgrounds.
Certain PBF designs (e.g., small funding amounts, over-emphasis on completion, or a lack of equity indicators) produce flawed accountability tools. When public universities face unstable, inadequate, and declining state funding, it is not surprising that many PBF policies fail to hold them accountable. The logic of accountability assumes that taxpayers and students need to be protected from colleges’ poor use of resources. However, as Figures 1 and 2 show (and as is also discussed later in Section III and Section IV), the true challenge facing students and taxpayers is a trifecta of declining state support for higher education, continually increasing tuition, and dropping enrollment and completion numbers. This pattern prevents progress toward preparing a 21st-century workforce.

Section III The Adequacy Alternative
Origins of the Idea of Funding Adequacy
The idea of funding “adequacy” has routinely been used in K-12 finance studies and policy reports. For instance, Odden et al. estimated adequate funding levels for each of the 50 states (plus the District of Columbia) by considering average salaries of instructional staff adjusted for cost of living, as well as individual teacher salaries.50 They found that 30 states fell short of adequately funding schools. However, their study focused on estimating a measure of funding adequacy and examining cross-state variation in achieving that measure rather than considering how schools were funded within states.
Within states, individual schools can receive widely varying amounts of state support.51 Schools that receive the least funding have often argued that they are inadequately funded as both a practical and a legal matter. From 1973 to 2017, there were lawsuits in 46 states arguing that state funding allocations for K-12 education were unconstitutional.52 In 22 states, courts ruled that state funding systems were, in fact, unconstitutional. Many funding adequacy court cases consider spending based on percentages of enrolled students who are from low-income or racial minority backgrounds. When states were ordered by courts to increase funding to inadequately supported schools, public schools realized increases in per-student spending and sizable increases in graduation rates, ranging from approximately 7 to 12 percentage points.53 In higher education, the idea of adequately funding colleges and universities has tended to focus on addressing historical inequities in the persistent underfunding of Historically Black Colleges and Universities by state governments.54 How should states conceptualize a standard for funding adequacy? One study suggests working backward from a state-articulated measure of academic performance. Feng and colleagues examined funding (in)adequacy in Ohio based on the Ohio Department of Education’s performance index. Under the state index, schools received a passing grade if they had a performance index score of 60% or higher.55 Based on the state’s performance index goal, Feng and colleagues concluded that 34 school districts needed additional state support.
Applying the Idea of Funding Adequacy to Today’s Higher Education
In the context of Illinois, funding adequacy should be considered in terms of supporting the state’s 60 by 25 goal. In A Thriving Illinois: Higher Education Paths to Equity, Sustainability, and Growth, the Illinois Board of Higher Education highlighted the importance of addressing the state’s geographic and racial diversity when addressing inadequate funding and inequitable attainment.56 The literature on adequately funding K-12 schools suggests that Illinois policymakers must begin any conversation about adequacy-based funding by first acknowledging that students have different needs, and that it is challenging for colleges and universities to graduate students who are less academically prepared or who have less family financial support.57
College completion rates have declined since the 1970s, as less selective public colleges (i.e., campuses that are not state flagships) have broadened access. As state universities admitted more students, states reduced spending on higher education and institutions changed instructional expenditures.58 In other words, greater numbers of students enrolled in higher education, but they attended colleges that, compared to state flagships, had fewer resources to support them.
In addition to instructional expenditures, one important study examined institution-level student services expenditures from four-year campuses for the 2002-2003 and 2005-2006 academic years.59 Webber and Ehrenberg found that institutional expenditures on costs and activities related to student services positively influenced persistence among first-year students and graduation rates. Additionally, they estimate that for every additional $100 per student spent on student services, graduation rates would increase 0.4 percentage points at schools where students have relatively low SAT scores, but a similar spending increase would only positively influence graduation rates by 0.1 percentage points at a four-year college or university with higher average SAT scores.
Note that not all expenditure increases are positively associated with favorable institutional outcomes. For instance, a $100-per-student increase in research expenditures was estimated to reduce graduation rates by -0.9 percentage points. Simulations suggest that, if it were necessary, there may be a beneficial tradeoff between additional instructional spending and student services spending. According to Webber and Ehrenberg’s estimates, reducing instructional expenditures by $100 per student and reallocating those funds to student services could increase graduation rates by up to 0.33 percentage points at schools where students generally have lower SAT scores.60 In summary, overall increases in allocations to public higher education lead to increases in student enrollment and graduation.61 However, the ways in which colleges and universities allocate funding to different categories of expenditures, such as instruction or student services, also matters.62
In higher education today, funding adequacy is critical to support educational equity. We must consider that different colleges and universities serve different populations of students and that low-income and racially minoritized students may require additional, adequate, and stable investment in student services and instructional expenditures to have equal opportunity to graduate. The state will not be able to meet its current 60 by 25 goal without increasing graduation rates among these students. Given how state appropriations are distributed across stratified institutions of public higher education, the lack of adequate funding primarily jeopardizes postsecondary access and success for historically underrepresented students and threatens the social justice mission of contemporary higher education.63

Section IV How Adequate is Higher Education Funding in Illinois?
Public financial support is essential to college attendance and completion, and reductions in per-student resources can produce academic barriers for students in the form of diminished instruction time, a lack of course availability, and insufficient support services.64 Cost-cutting policies can also diminish institutional capacity to produce returns to students and taxpayers or force institutions to increasingly rely on revenue from tuition and fees.65 Moreover, unequal public financial support can intensify the hierarchy within higher education such that more advantaged institutions tend to receive more stable financial resources when compared to institutions that may have a greater need for public funds.66
As public four-year institutions in Illinois heavily rely on state operating funding to fulfill their mission, funding adequacy is critical for offering wraparound student support services to ensure that student not only enroll, but also succeed in higher education.67 Without adequate funding, attending an Illinois public four-year college appears to be a risky decision for students, especially historically underrepresented students. The data show that in Illinois, inequities exist in college access, student support services, and post-enrollment outcomes. Preliminary data suggest that because institutions are inconsistently and inadequately funded, students’ opportunities to benefit from Illinois public higher education largely depend on where they enroll.
Enrollment and Achievement Gaps
Colleges and universities need adequate funding in order to create equitable access to higher education, and then to support equitable outcomes. As previously mentioned, when states cut funding to public universities, student enrollments tend to shift to the for-profit sector, which is particularly problematic because for-profit colleges need to be regulated to prevent predatory practices.68 For instance, in Illinois, Black students are underrepresented in the student body of public educational institutions relative to their share of the total state population. Around 14.1% of people in Illinois are Black, but only about 12.5% of public four-year college students in Illinois are Black. As a proportion of the population, Black student enrollment lags behind states like Indiana and Kentucky.69
Additionally, as referenced in the Illinois Board of Higher Education report, Black student enrollment dropped by more than one-third (34%) between 2013 and 2019.70 The drop in Black enrollment outpaced overall decline in Illinois college enrollment (19.4%) and for White students (25.9%). After one year, four-year public universities retain only two-thirds of Black students but 85% of their White classmates. After six years, fewer than four in ten (38%) Black first-year college students earn four-year degrees, while more than seven in ten White students do the same.
Institutional Expenditures that Support Completion
As reviewed above, prior literature has examined the links between public funding for higher education, university expenditures, and student success. Students need wraparound services so they can succeed after enrolling in higher education. For instance, a survey of students at four public Illinois universities found that 35% of respondents experienced food insecurity.71 Students who are food insecure are more likely to take fewer classes, neglect their studies, or consider dropping out of college.72
When policymakers conceptualize holistic student success, they must consider whether students have access to support services that address mental health, physical wellness, and counseling after traumatic events.73 Yet, students’ access to such services varies depending on where they enroll. Illinois must address public funding for higher education as part of its broader efforts to achieve college enrollment and completion goals. Below, we examine how university expenditures vary at four-year public universities across the state.
Illinois public universities spend substantially different amounts on instruction and student support services. It is important to consider the adequacy of funding for instruction and student services in terms of nominal dollars, as well as the ratio of instructional to student support expenditures (Figure 5). For instance, University of Illinois Chicago has the highest spending per student and spends more on student support than most four-year public universities in the state. However, as a share of the two spending categories, University of Illinois Chicago spends the smallest ratio on student support.
Figure 5. Students of color and the ratio of support services to instruction expenditures
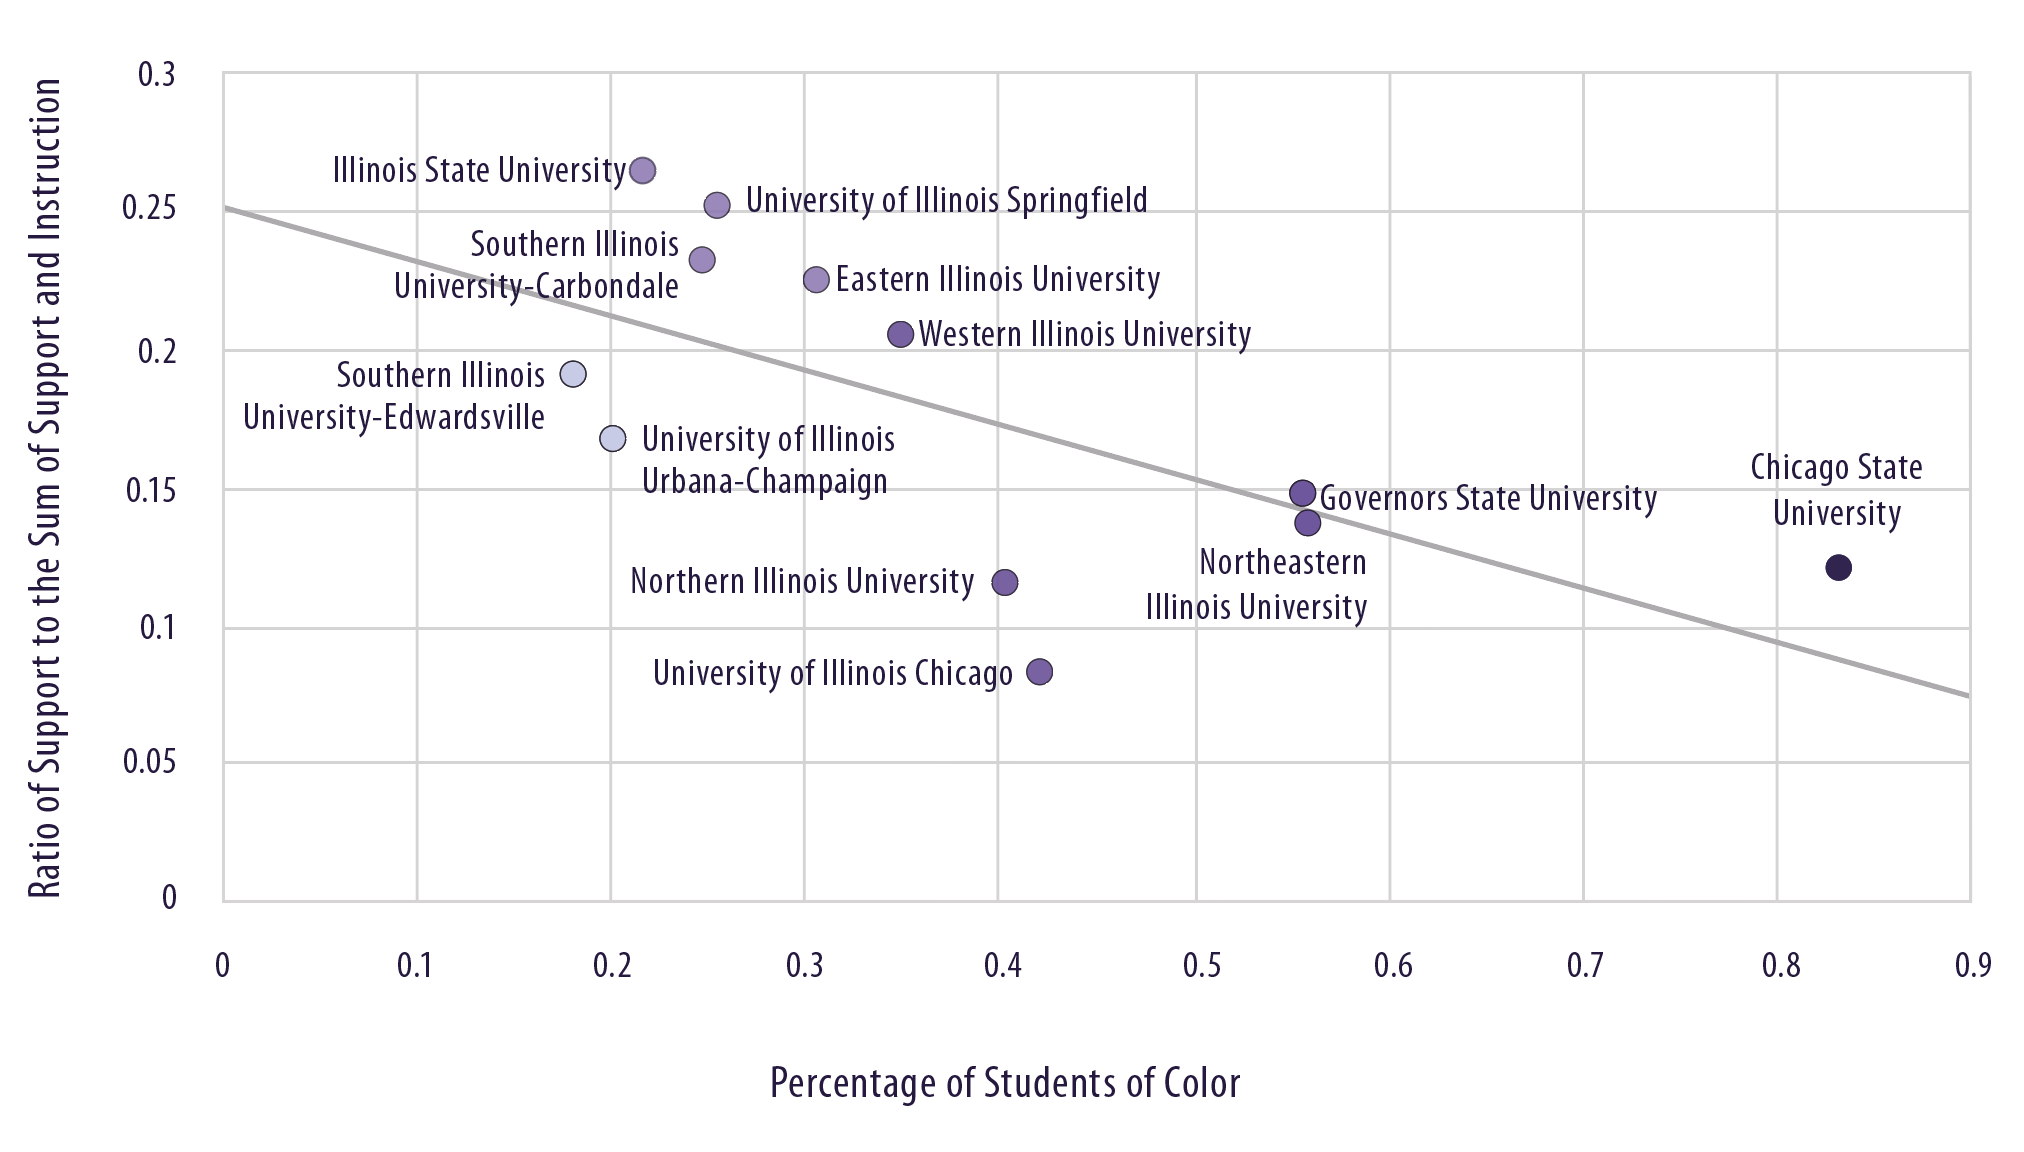
In Illinois, where you live and where you enroll determine what you get from public higher education. Recall that Webber and Ehrenberg found that student services expenditures support persistence and graduation rates at campuses that disproportionately serve less prepared college students.74 Even though Chicago State University serves a more impoverished region, per-student spending is higher at Southern Illinois University-Carbondale. Additionally, Southern Illinois University-Carbondale invests a larger share of its instructional/support spending on providing student services. In fact, the three universities that serve the Chicago region have some of the smallest ratios of student support expenditures, even though the region has some of the highest rates of poverty. This suggests that campuses that serve communities with greater needs for campus services are unable to adequately fund wraparound support programs.
Social Mobility
For higher education to foster social mobility, low-income students would need to have equitable access to college, and the benefit to earning a degree on post-graduation earnings would have to be similar across colleges. However, there is limited evidence that either of those conditions holds at scale. Chetty et al. showed that “the degree of parental income segregation across colleges is very high, similar to that across neighborhoods.”75 In other words, students sort into colleges based on family income.76 After graduation, alumni tend to earn more based on where they attended college, which is highly correlated with the incomes of their college classmates. Only a few regional public universities tend to admit sizable numbers of low-income students and help them earn more than would otherwise be predicted by their family income and academic preparation.77
Figure 6 presents the value of the social mobility indicator of public universities in Illinois, using the Mobility Report Card (MRC) data collected between 2000 and 2011.78 Although public university campuses are located throughout the state of Illinois, to the extent that students attend the nearest school, their life chances are constrained by where they are born in the state because their chances of getting ahead in life are determined by which state school they attend. Just as students have access to wildly different amounts of academic and student support services depending on which public university they attend, their opportunity to move into the middle or upper classes varies according to which institution they attend.
Affordability and Net Price of Attendance
The net price for first-time, full-time, in-state, degree-seeking students who receive any type of Title IV financial aid has been declining in Illinois, indicating effective efforts to address affordability between 2016 and 2020. However, the average net price remains higher than in neighboring states. Figure 7 indicates which institutions drive the higher net price when disaggrated by research intensity. For Illinois, the net price for less research-intensive public four-year universities is considerably higher than their peer institutions in neighboring states. Thus, even though the “sticker price” of attending a University of Illinois campus may be higher, students who do not attend the University of Illinois Urbana-Champaign or the University of Illinois Chicago actually pay a higher net price.
These findings are consistent with Taylor and Cantwell’s work as discussed in Section I.79 Students who attend Illinois’ most research-intensive universities benefit from the largest state subsidies; these are disproportionately students from higher income backgrounds and those whose parents have four-year degrees. The less research-intensive public universities in Illinois are meant to broaden access to higher education for students who come disproportionately from lower-income backgrounds or who are the first in their family to go to college. Yet, as Figure 7 shows, students at most Illinois public universities have historically paid a substantially higher net price than students at the research flagship campus. Although the gap narrowed by 2020, on average, students were still paying more to attend less research-intensive universities that were intended to be more affordable and broadly accessible.
Student Loan Debt
As student loan debt influences students’ graduate school attendance, occupational choice, and other major life events, it continues to exacerbate the inequity in accrued wealth and limit socioeconomic mobility among underserved sub-groups of students.80 When students graduate from the public four-year universities in Illinois, they face heavier student loan debt burdens when compared with graduates from public four-year universities in neighboring states, except for Iowa.
Again, when institutions are disaggregated by research intensity, the average student loan principal upon entering repayment seems to be driven by the non-highest research institutions. In other words, students from the 10 less research-intensive public four-year universities ended up with higher student loan debt than students from UIUC and UIC. Although attending one of the most research-intensive universities is inexpensive compared to attending research-intensive flagships in surrounding states like Iowa, Michigan, Missouri, and Wisconsin, students who attend less research-intensive universities in Illinois leave with larger student loan debt, on average, than their counterparts in neighboring states.
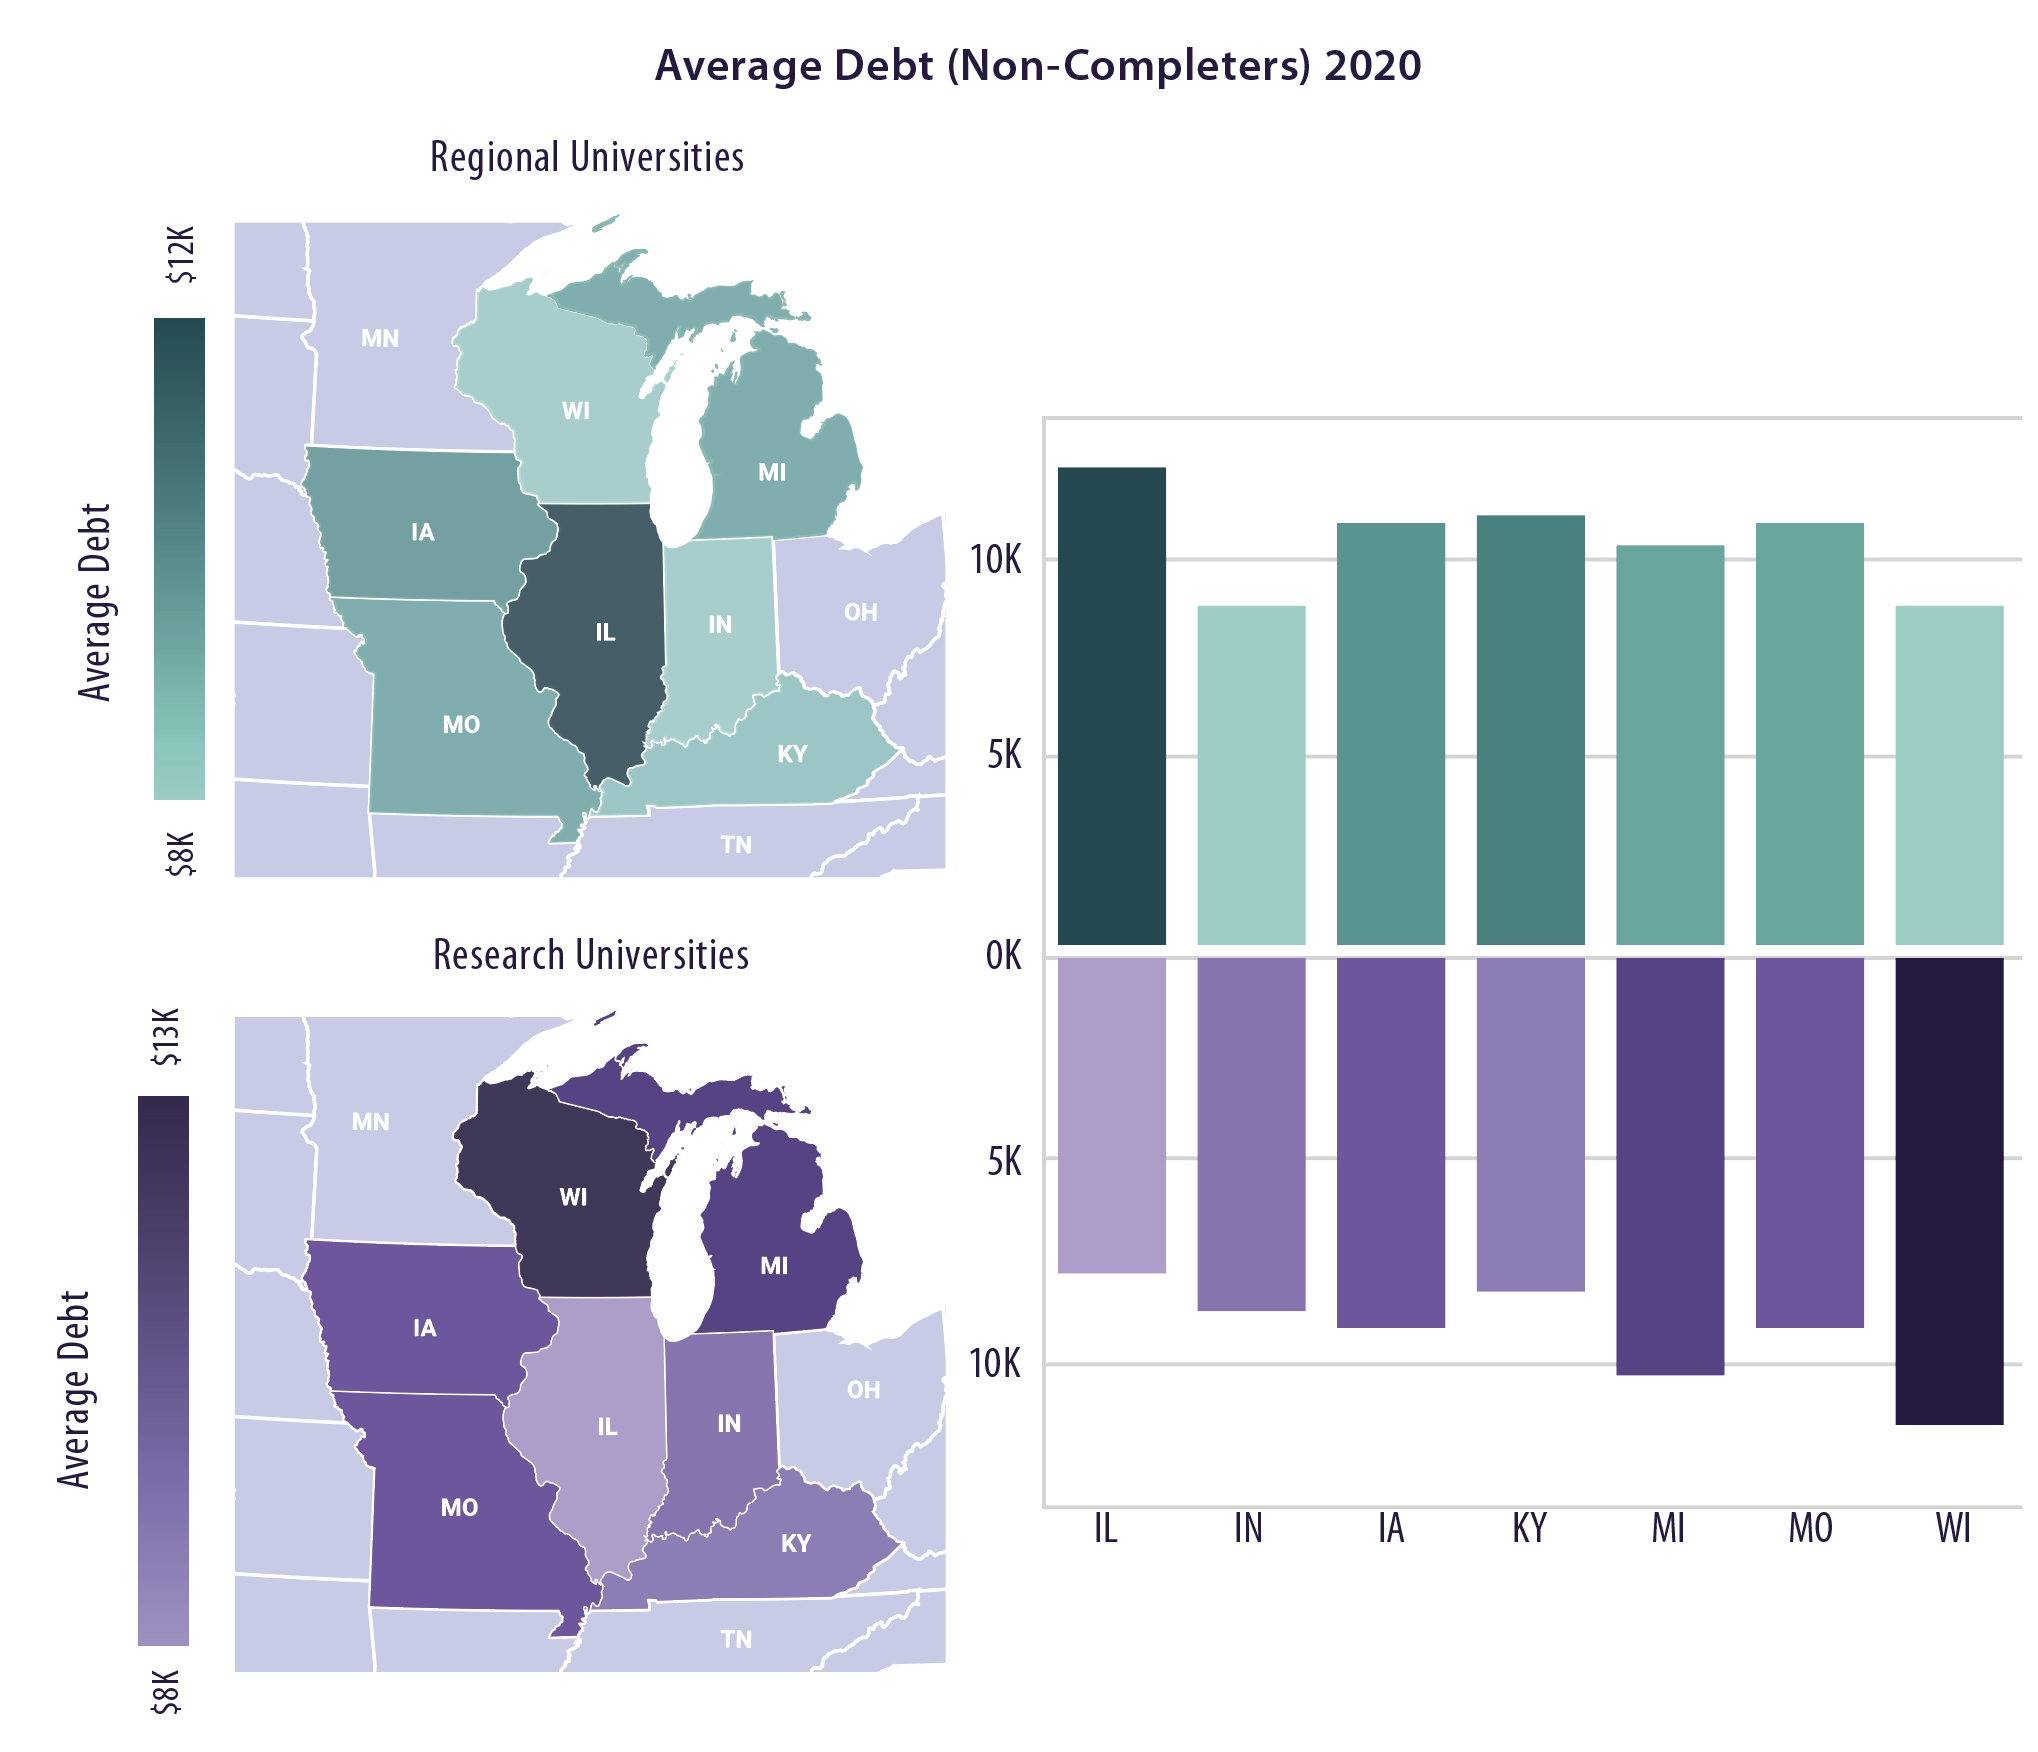
As student loan debt often becomes a heavy burden for college graduates, we further disaggregate the average student loan debt for low-income students and non-completing students (see Figure 8 and 9).81 For instance, students that started college but did not complete can have a higher debt-wage ratio.82 The non-completing students, who are more likely to be traditionally underserved, were, on average, more negatively impacted by heavy student loans.83 Relative to other states in the region, loan debt was particularly burdensome among students attending less research-intensive public universities (i.e., schools other than University of Illinois Urbana-Champaign and University of Illinois Chicago).
Figure 6. Social mobility index and percentage of Black and Latinx students
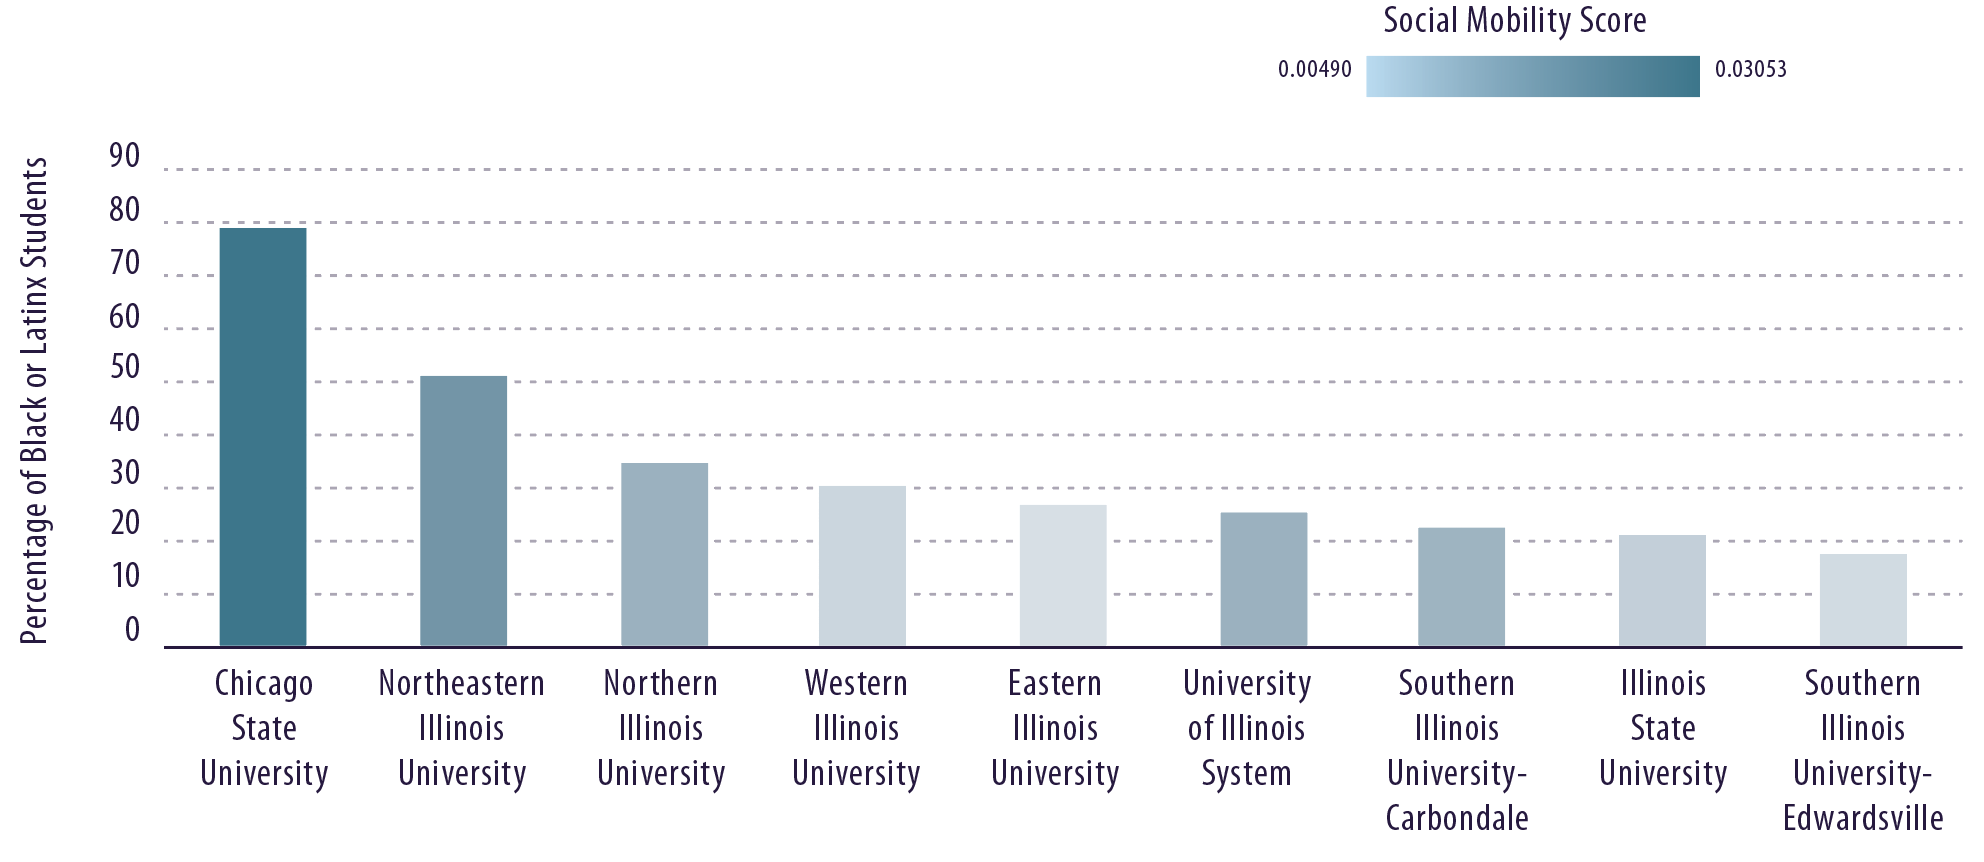
Note: The social mobility indicator was calculated, for a given college, as the product term of the fraction of low-income students (i.e., having parents in the bottom quintile of the parents’ income distribution) and the fraction of low-income students reaching the top 20% of the student earnings distribution in their 30s.84 For example, Chicago State University admits a higher proportion of low-income students and a larger proportion of them went on to reach the top quintile of earnings in their 30s. However, Illinois State University admits a smaller proportion of low-income students and a smaller group of students were able to move up the income ladder from the bottom quintile to the top quintile.
Figure 7. Average net price for first-time, full-time, in-state, degree-seeking students who receive any type of Title IV financial aid (2022 constant dollars)
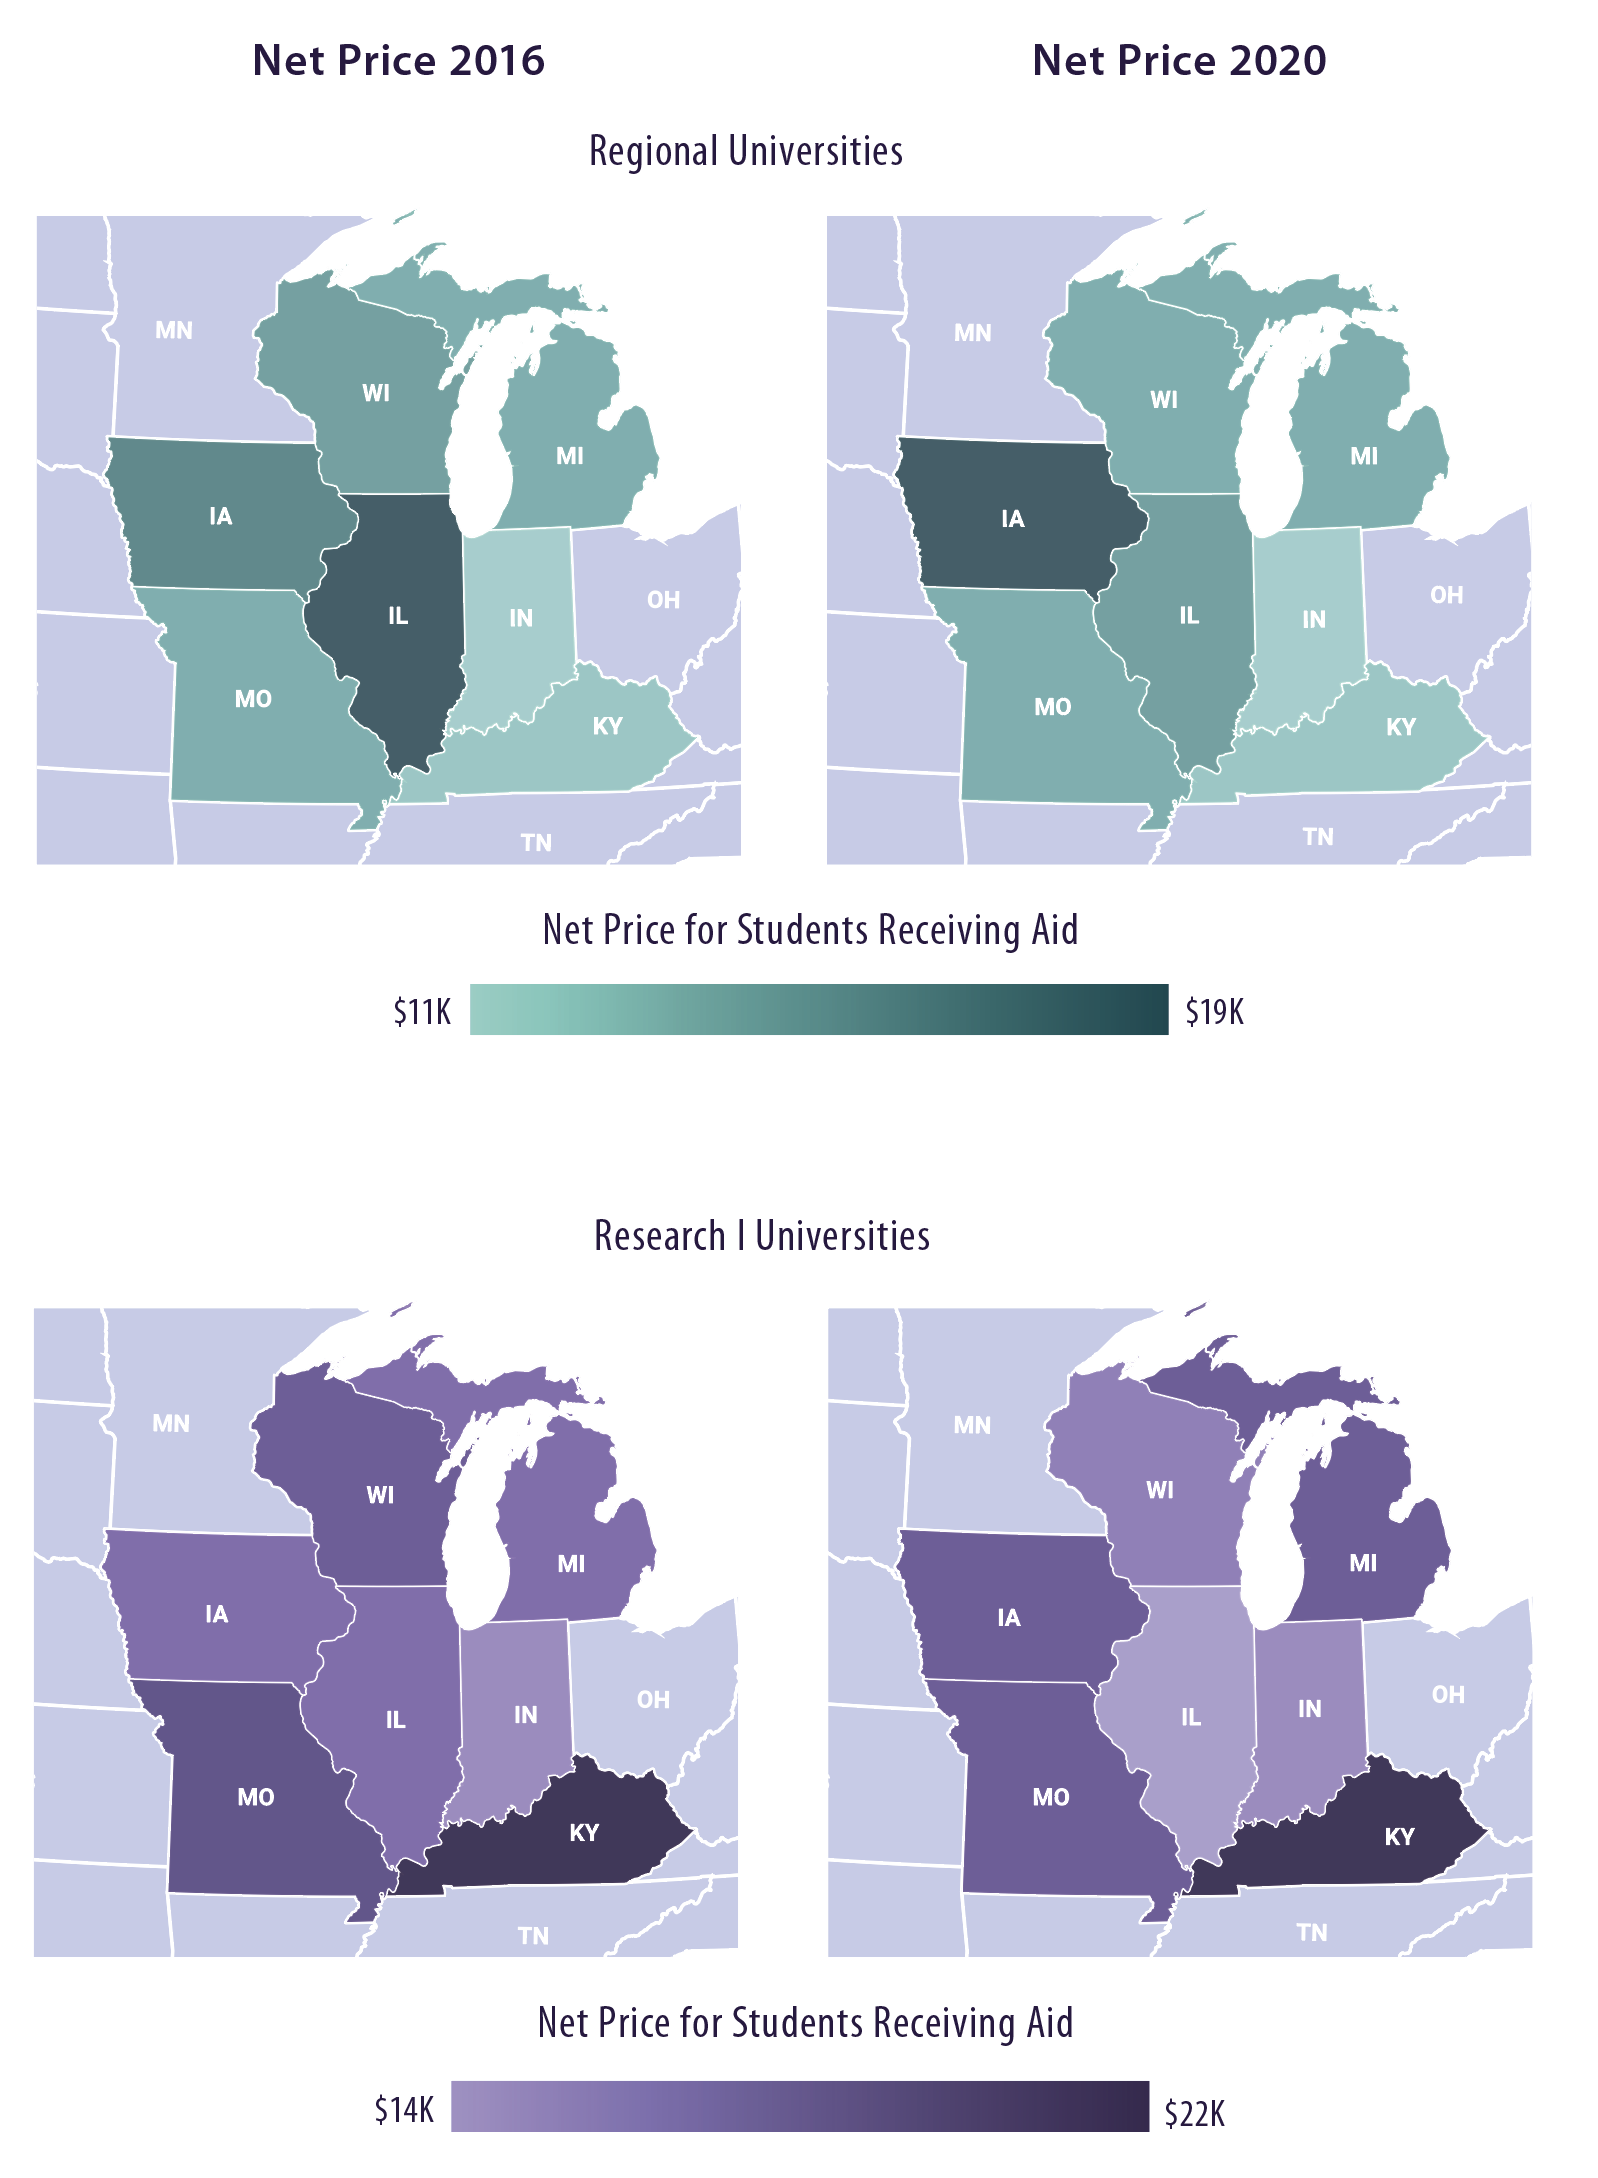
Figure 8. Median amount of student loan principal for low-income students upon entering repayment (2022 constant dollars)
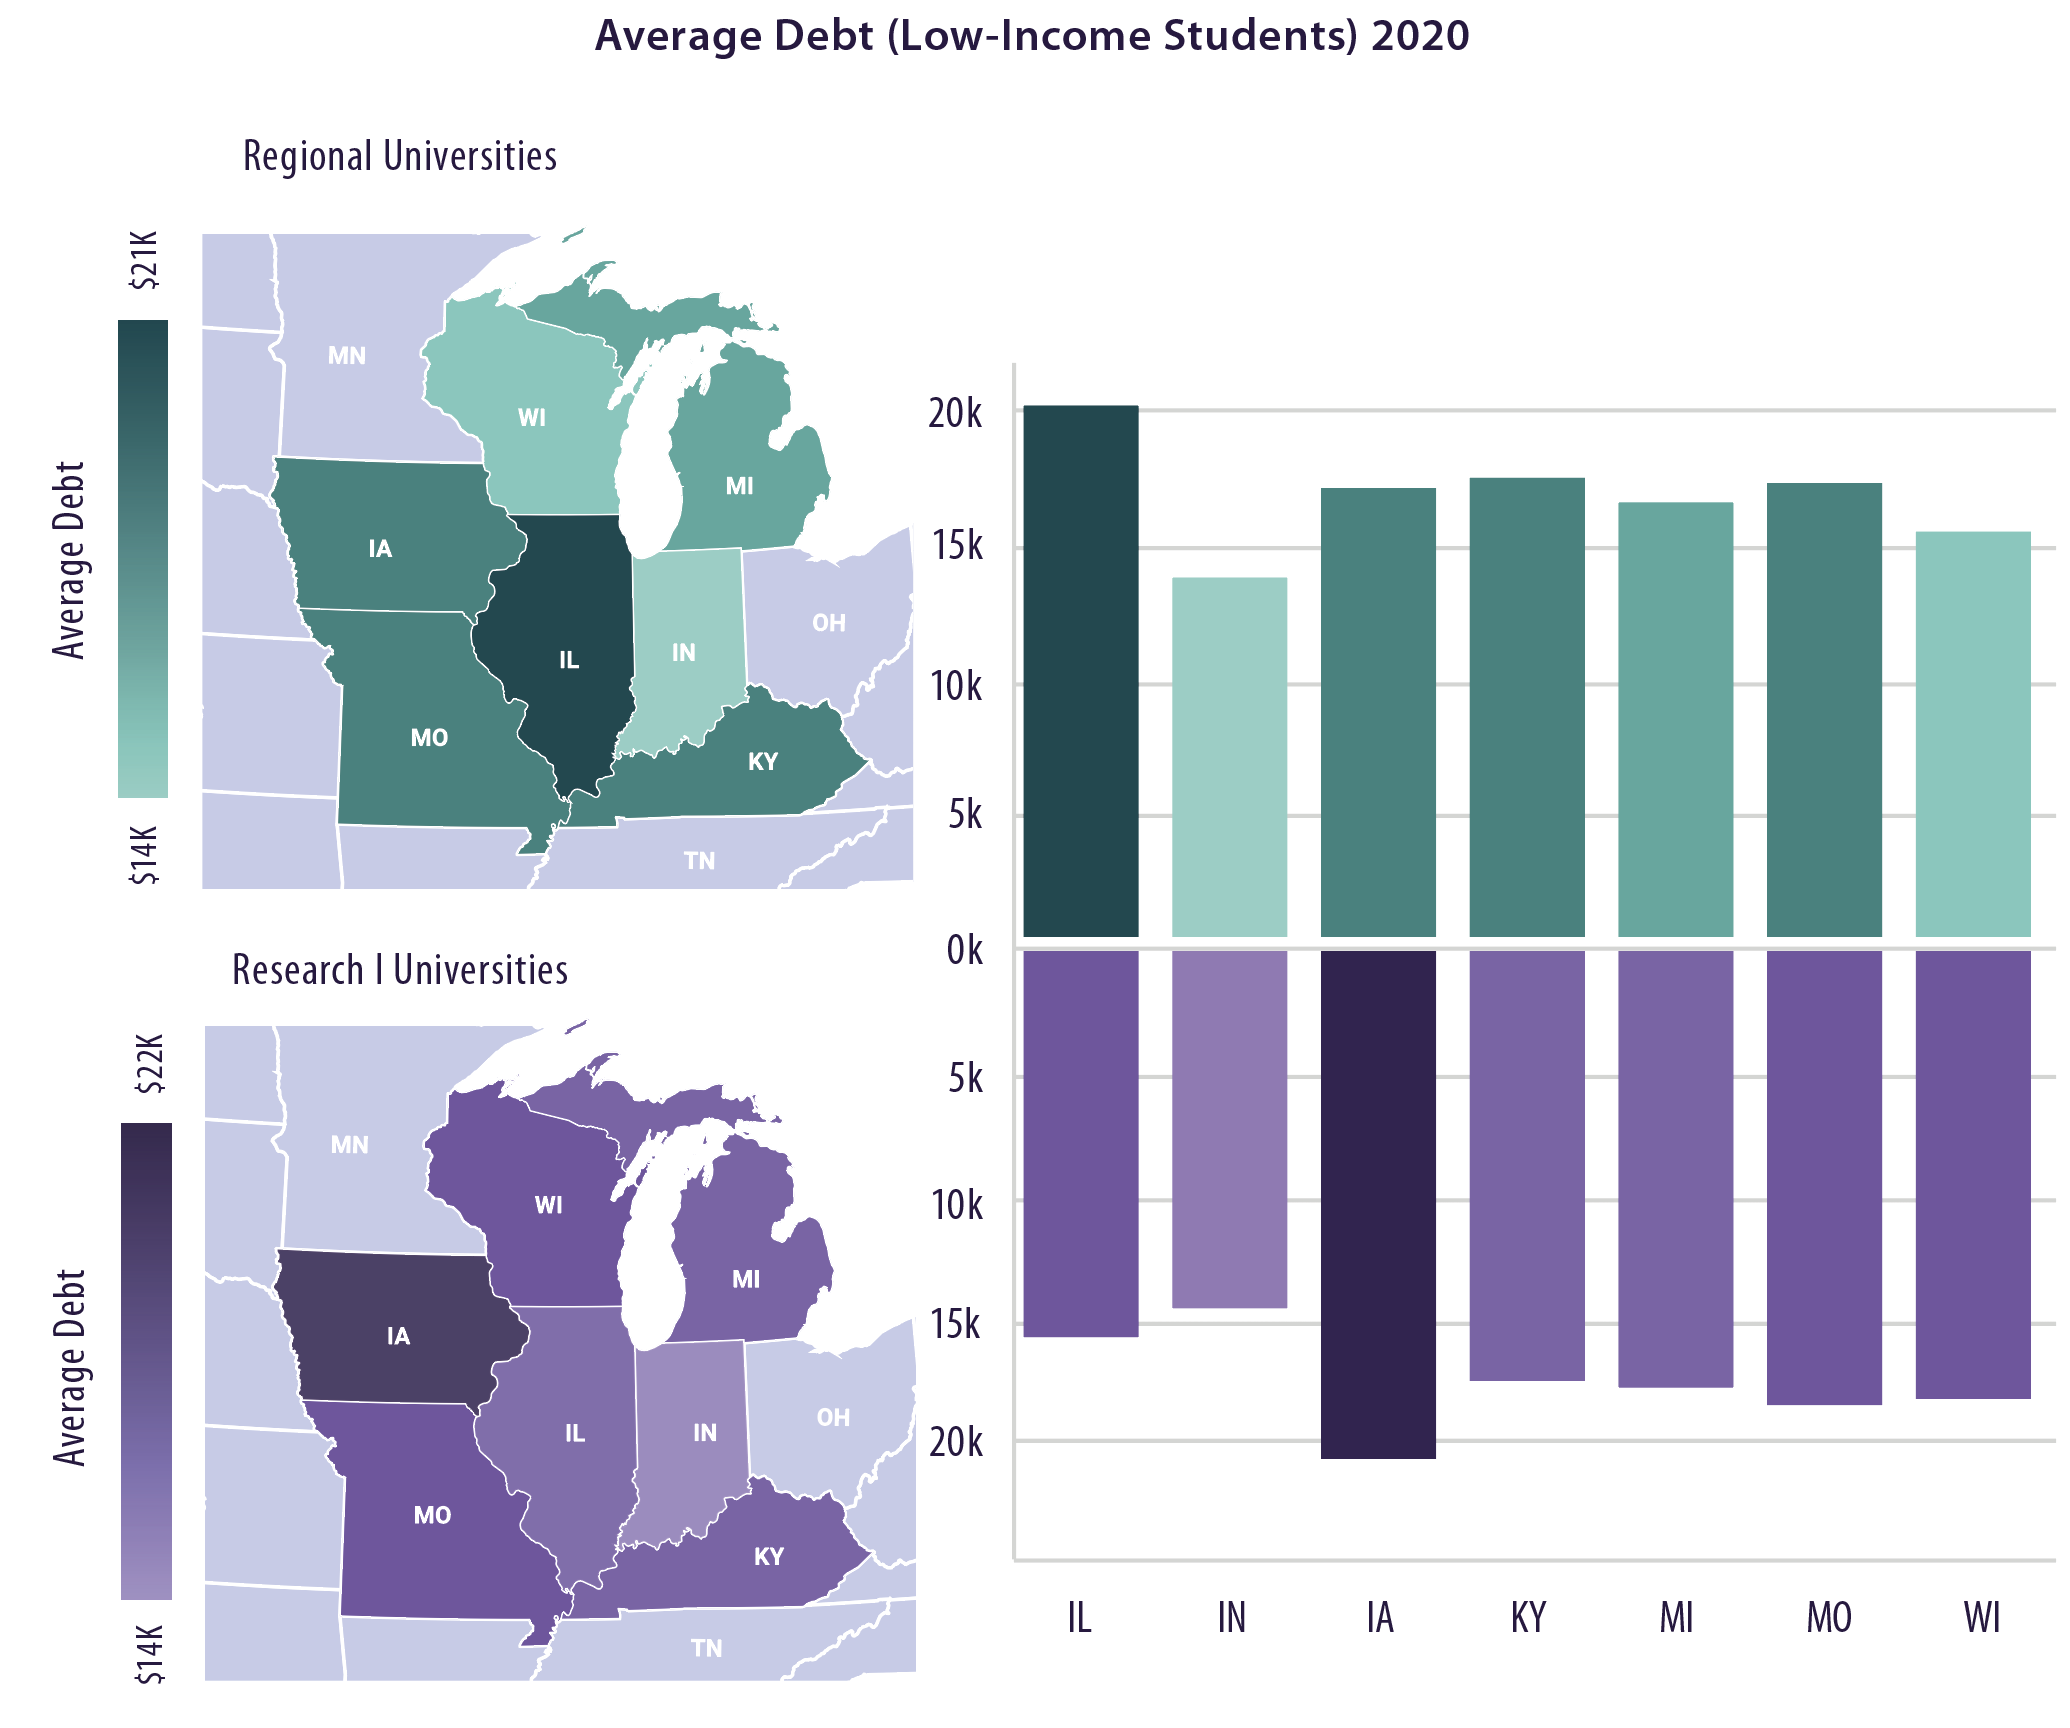
Figure 9. Median Amount of Student Loan Principal Upon Entering Repayment (2022 Constant Dollars) by Student Characteristics
Section V Implications and Policy Recommendations for Adequately Funding Higher Education in Illinois
Implications and Policy Recommendations for Adequately Funding Higher Education in Illinois
Illinois has a robust system of public higher education. Despite challenges beyond its control (a pandemic, economic recessions, inflation), the state has an opportunity to recommit itself to higher education as a state asset and its goal that 60% of working-age state residents earn a postsecondary credential.85 As of 2019, fewer than four in ten Illinois residents between the ages of 25 and 64 had earned four-year degrees.86 To remain nationally and globally competitive in the 21st century knowledge economy, Illinois will need to move toward adequately funding public universities to provide an equitable college education. In the remainder of this section, we draw on our findings above to offer recommendations for Illinois policymakers as they consider future appropriations.
When state funding is persistently low, universities become increasingly reliant on tuition. When universities are overly reliant on tuition, their ability to absorb each new cut in state funding (whether nominal or inflation-adjusted) is limited by their ability to increase tuition and fees and to enroll more students. Over the past decade, inadequate funding has led Illinois universities to try multiple strategies to stay solvent.

Policy Recommendations
1. Consider Within-State Funding Inequities
2. Improve Equity for Black Students in Both Access and Success
3. Restore Cuts to Public Universities
4. Address Differences in Fixed and Variable Costs to Provide Student-Centered Support
5. Consider Regional Competitiveness
6. Adopt New Measures of Success (or Accountability)
7. Avoid the Pitfalls of Performance- or Outcomes-Based Funding Models
- Public universities in Illinois have different enrollment pressures (e.g., declining, increasing), which can influence how they absorb funding cuts
- University spending to support and instruct students varies substantially across the state (both in nominal dollars and proportionately)
- To the extent that students enroll at the four-year college closest to their hometown, where students are born determines what they get from the Illinois system of public higher education
- Policymakers should consider pursuing geographic or distributional equity to even out funding for public four-year universities serving rural parts of the state (see Figure 1)
- Public universities serving lower-income counties should have at least equal, if not more, funding to support student success than universities in higher-income counties
As discussed in Section IV, Illinois is doing a particularly poor job of supporting Black students in higher education, and the state is undermining its goal of improving college attainment by underserving the Black population. While policymakers may be constrained from using race-conscious admissions or directly considering race in appropriations, they should consider how to keep the cost of college affordable and to adequately fund wraparound student services to support success at public universities that disproportionately serve Black students.
- Black student enrollment at Illinois public four-year universities dropped by more than one-third between 2013 and 2019
- When Black students enroll in Illinois public four-year universities, those universities disproportionately place them in developmental courses that do not lead to college credits (15% compared to only 5% of White students)
- As a result, Black students tend to earn fewer college credits than White students in their first semester, and after only a single semester on a four-year college campus, Black students are already off-track to earn a baccalaureate degree in four years88
- Four-year public universities retain only two-thirds of Black students but 85% of their White classmates one year after initial enrollment
- After six years, fewer than four in ten (38%) of Black first-year college students earn four-year degrees, while more than seven in ten White students do the same
As discussed in Section I, Illinois universities are operating with less state funding than they had before or during the height of the COVID-19 pandemic. As public funding decreased, universities increased tuition and fees, and they made year to year changes in how adequately they funded student services. Yet, increasing tuition and fees and cutting student services cannot remedy cuts in state appropriations.
- At a minimum, base appropriations to higher education should be increased to restore inflation-adjusted cuts to public university funding
- Additionally, because of the recent spike in inflation, 2020 appropriations were even worse when we compared them to 2017 constant dollars
- Policymakers need to consider how persistently high inflation continues to dilute the purchasing power of state appropriations to public universities
Universities need adequate funding for instruction and student services to support success. Enrollment-based funding is often calculated based on full-time equivalent students. While funding based on full-time equivalent students may make more sense for instructional costs (where part-time students do not enroll in as many courses), part-time enrollments have different implications for adequately funding student services. As shown in this report, funding adequacy should be considered using total headcount calculations.
- A part-time student requires as much institutional investment as a full-time student for services like advising or assessing students for disability accommodations
- Avoid defaulting to funding universities based on full-time equivalent enrollments; instead, policymakers should consider providing equitable levels of funding for per-student (i.e., headcount) instructional and support services expenditures
- Fixed costs associated with the day-to-day operational support of the institution do not change according to students’ enrollment status; policymakers should consider adopting a funding minimum for per-student support expenditures
Compared to neighboring states, Illinois needs to improve access and success for its students. The system of public higher education in Illinois serves too few Black students. Additionally, the cost of public higher education is too high, and too many Illinois students leave college with higher student loan debt than students in surrounding states.
- Illinois does not equitably educate its Black population, but other states in the region (e.g., Indiana and Kentucky) demonstrate that states can, in fact, close
the enrollment gap - Students at Illinois public universities, particularly those who attend the state’s less-research-intensive campuses, pay a higher net price and accrue more student loan debt than (a) students at Illinois’ flagship universities and (b) students at public universities in many surrounding states
- The high cost of student loans in Illinois is especially problematic for low-income students and students who do not complete their degrees
Policymakers traditionally rely on institutional metrics (e.g., retention and graduation rates) that take place between when students first enroll and when they leave campus. Those metrics can be manipulated, and institutions can blame individual students when they fall short (i.e., ‘students dropped out’ rather than ‘we failed to retain them’). Furthermore, traditional metrics are disconnected from broader aims
of broadening college access and making college more affordable.
- In addition to traditional metrics (first-year retention, graduation rates), Illinois should prioritize expanding equitable access by bringing down the net price
of attendance at the state level - Institutions should focus on equitably enrolling diverse students (low-income,
first-generation, racial minority) from surrounding counties - At the state and institutional levels, leaders should commit to reducing student
loan debt and improving social mobility across institutions
The intuition of performance-based funding goes against the assumptions of adequacy-based funding. Performance-based funding assumes that universities are so cash-strapped that they will innovate to improve student success on traditional metrics (e.g., retention, graduation rates). Further, zero-sum, performance-based funding exacerbates rather than ameliorates inequities among universities within a state. As we have shown, enrollment patterns and instructional and student service expenditures already vary widely across Illinois.
- Prior research demonstrates that performance-based funding creates perverse incentives, such as limiting access to higher education (especially for less-prepared, lower-income, or racial minority students)
- At best, performance-based funding formulas can minimize unintended consequences on vulnerable populations
- Prior research indicates that performance-based funding policies generally do not lead to improvements in student outcomes or institutional equity
- State funding should prioritize capacity-building for institutions to overcome financial hardship and enrollment decline
Future Data Needs for Understanding Funding Adequacy and Promoting Accountability
Throughout the process of preparing this report, we drew on a variety of publicly available state and institutional data. We were not able to disaggregate institution revenues and expenditures to pursue additional considerations for how to adequately fund higher education. For instance, if statewide, longitudinal data were made available to researchers, we could examine:
- Beyond raw totals of instructional expenditures, what is the institutional cost of hiring full-time faculty members (and how does it vary across fields like engineering and education), and how do those costs reflect local cost of living?
- We now know student support and instructional spending vary substantially across Illinois’ public universities. What does that mean within campuses? How do annual changes in appropriations and expenditures influence faculty- and academic adviser-to-student ratios?
- Within and across colleges and universities, how do instructional and student support services costs influence institutions’ abilities to equitably serve part-time, low-income, first-generation, and underrepresented racial minority students?

End Notes
- Illinois Board of Higher Education. (2021). A thriving Illinois: Higher education paths to equity, sustainability, and growth. https://ibhestrategicplan.ibhe.org/pdf/A_Thriving_Illinois_06-15-21.pdf
- Illinois Board of Higher Education. (2017). The 60 by 2025 goal for Illinois. https://www.ibhe.org/pdf/60x2025goal2017.pdf; Illinois Board of Higher Education. (2021); Prescott, B., Koch, Z., & Jones, D. (2021). Considering a standard approach to determining institutional funding adequacy. The National Center for Higher Education Management Systems.
- Illinois Board of Higher Education, 2021.
- Looney, A., & Yannelis, C. (2015). A crisis in student loans?: How changes in the characteristics of borrowers and in the institutions they attended contributed to rising loan defaults. Brookings Papers on Economic Activity, 2015, 1-89. https://doi.org/10.1353/eca.2015.0003
- Delaney, J. A., & Doyle, W. R. (2011). State spending on higher education: Testing the balance wheel over time. Journal of Education Finance, 36(4), 343-368. https://www.jstor.org/stable/23018116; Hovey, H. A. (1999). State spending for higher education in the next decade: The battle to sustain current support. San Jose, CA: National Center for Public Policy and Higher Education.
- Doyle, W. R., Dziesinski, A. B., & Delaney, J. A. (2021). Modeling volatility in public funding for higher education: An analysis using propensity forests. Journal of Education Finance, 46(4), 563-591. https://muse.jhu.edu/article/796980
- State Higher Education Executive Officers Association. (2021). State higher education finance: FY 2021. Boulder, CO.
- National Student Clearinghouse. (2022). Persistence and retention: Fall 2020 beginning postsecondary student cohort. https://nscresearchcenter.org/wp-content/uploads/PersistenceRetention2022.pdf. p. 4.
- National Student Clearinghouse. (2022). p. 5.
- Taylor, M., & Melidona, D. (2021, November 8). First look: Use of Higher Education Emergency Relief Funds (HEERF) at U.S. colleges and universities. American Council on Education. https://www.acenet.edu/Research-Insights/Pages/Senior-Leaders/Presidents-Survey-HEERF.aspx
- The Institute for College Access & Success. (2021). Higher Education and state budgets: First lessons from the pandemic. The Institute for College Access & Success. https://ticas.org/wp-content/uploads/2021/11/Higher-Education-and-State-Budgets-First-Lessons-from-the-Pandemic.pdf
- Kelchen, R., Ritter, D., & Webber, D. (2021). The lingering fiscal effects of COVID-19 pandemic on higher education (DP 21-01). Federal Reserve Bank of Philadelphia, Consumer Finance Institute. https://doi.org/10.21799/frbp.dp.2021
- Because the state retirement pension system has been historically underfunded in Illinois, the state government has devoted a large proportion of its operating funding for liabilities from past years. General Funds contributed to the pension fund for university and community college employees climbing from $1.48 billion in FY2017 (unadjusted) to over $1.9 billion in FY2023 (i.e., 46.3% of total state general revenues for higher education appropriations).
- Partnership for College Completion. 2020 Higher education appropriations: A framework for equity in Illinois. https://partnershipfcc.org/wp-content/uploads/2021/11/PCC_Equity_Framework_Final-1.pdf
- Illinois Board of Higher Education, 2021.
- Deming, D. J., & Walters, C. R. (2018, February). The impact of state budget cuts on US postsecondary attainment (Working Paper). https://scholar.harvard.edu/files/ddeming/files/dw_feb2018.pdf
- Ibid, p.8.
- Blose, G. L., Porter, J. D., & Kokkelenberg, E. C. (2006). The effect of institutional funding cuts on baccalaureate graduation rates in public higher education. In R. G. Ehrenberg (Ed.), What’s happening to public higher education: The shifting financial burden (pp. 71-82). Greenwood Publishing. p. 77.
- Bahr, P. R., Gross, J. L., Slay, K. E., & Christensen, R. D. (2015). First in line: Student registration priority in community colleges. Educational Policy, 29(2), 342-374. https://doi.org/10.1177/0895904813492381; Bound, J., Lovenheim, M. F., & Turner, S. (2012). Increasing time to baccalaureate degree in the United States. Education Finance and Policy, 7(4), 375-424. https://doi.org/10.1162/EDFP_a_00074
- Illinois Board of Higher Education, 2017.
- Lumina Foundation. (n.d.). We Are Tracking Illinois’ Progress. https://luminafoundation.org/stronger-nation/report/#/progress/state/IL
- Chetty, R., Friedman, J. N., Saez, E., Turner, N., & Yagan, D. (2020). Income segregation and intergenerational mobility across colleges in the United States. The Quarterly Journal of Economics, 135(3), 1567-1633. https://doi.org/10.1093/qje/qjaa005
- Taylor, B. J., & Cantwell, B. (2018). Unequal higher education in the United States: Growing participation and shrinking opportunities. Social Sciences, 7(9), 1-22. https://doi.org/10.3390/socsci7090167; Taylor, B. J., & Cantwell, B. (2019). Unequal higher education: Wealth, status, and student opportunity. Rutgers University Press.
- Ibid.
- Ibid.
- Lederman, D. (2021, August 2). The number of colleges continues to shrink. Inside Higher Ed. https://www.insidehighered.com/news/2021/08/02/number-colleges-shrinks-again-including-publics-and-private-nonprofits
- Goodman, S., & Volz, A. H. (2020). Attendance spillovers between public and for-profit colleges: Evidence from statewide variation in appropriations for higher education. Education Finance and Policy, 15(3), 428-456. https://doi.org/10.1162/edfp_a_00281
- Lingenfelter, P. E. (2008). The financing of public colleges and universities in the United States. In H. F. Ladd & M. E. Goertz (Eds.), Handbook of research in education finance and policy (pp. 651-670). Routledge. p. 658.
- McKeown-Moak, M. P. (1999). Higher education funding formulas. New Directions for Higher Education, 1999(107), 99-107. https://doi.org/10.1002/he.10710
- Shulock, N. & Moore, C. (2007). Rules of the game: How state policy creates barriers to student completion and impedes student success in California’s Community Colleges. Institute for Higher Education Leadership and Policy, California State University. https://edinsightscenter.org/Portals/0/ReportPDFs/rules-of-the-game.pdf?ver=2016-01-15-155407-347
- Nguyen, S., Fishman, R., Weeden, D., & Harnisch, T. (2021). The impact of COVID-19 on state higher education budgets: A tracker of responses from state higher education systems and agencies. New America. https://www.newamerica.org/education-policy/reports/state-budget-cuts/
- Higher Education Finance Study Commission. (2010). Higher education finance study commission report. https://web.archive.org/web/20150906043640/http://www.ibhe.state.il.us/SJR88/Materials/FinalReport.pdf; Parmley, K., Bell, A., L’Orange, H., & Lingenfelter, P. (2009). State budgeting for higher education in the United States. State Higher Education Executive Officers Association. https://files.eric.ed.gov/fulltext/ED506284.pdf
- Hearn, J. C. (2015). Outcomes-based funding in historical and comparative context (Lumina Issue Paper). Lumina Foundation for Education. https://files.eric.ed.gov/fulltext/ED561322.pdf
- (Parmley et al., 2009, p. 13)
- Hearn, 2015; Lingenfelter, 2008; McLendon, M. K., Mokher, C. G., & Doyle, W. (2009). “Privileging” public research universities: An empirical analysis of the distribution of state appropriations across research and non-research universities. Journal of Education Finance, 34(4), 371-401. https://www.jstor.org/stable/40704366)
- Ortagus, J. C., Kelchen, R., Rosinger, K., & Voorhees, N. (2020). Performance-based funding in American higher education: A systematic synthesis of the intended and unintended consequences. Educational Evaluation and Policy Analysis, 42(4), 520–550. https://doi.org/10.3102/0162373720953128; Snyder, M. (2015). Driving better outcomes: Typology and principles to inform outcomes-based funding models. HCM Strategists. https://reportcenter.highered.texas.gov/sites/docid/cache/file/8A58AFCC-F985-AACC-7EABAB8B5F9E5D22.pdf)
- Dougherty, K. J., & Natow, R. S. (2015). The politics of performance funding for higher education: Origins, discontinuations, and transformations. Johns Hopkins University Press.
- (Burke 1998; Dougherty & Natow, 2015; Dougherty & Reddy, 2011)
- Illinois Board of Higher Education. (2018). Overview: Current performance funding model. https://www.ibhe.org/fiscal/Performance_Funding_Overview_Presentation.pdf
- For more on how state policies can include features of both PBF 1.0 and 2.0, see Rosinger, K. O., Ortagus, J., Kelchen, R., Cassell, A., & Brown, L. C. (2022). New evidence on the evolution and landscape of performance funding for higher education. The Journal of Higher Education, 1-34. https://doi.org/10.1080/00221546.2022.2066269
- Blankenberger, B., & Phillips, A. (2016). Performance funding in Illinois higher education: The roles of politics, budget environment, and individual actors in the process. Educational Policy, 30(6), 884-915. https://doi.org/10.1177/0895904814556748
- (Ortagus et al., 2020)
- Hillman, N. W., Tandberg, D. A., & Gross, J. P. (2014). Performance funding in higher education: Do financial incentives impact college completions? Journal of Higher Education, 85(6), 826–857. https://doi.org/10.1353/jhe.2014.0031; Hillman, N. W., Tandberg, D. A., & Fryar, A. H. (2015). Evaluating the impacts of “new” performance funding in higher education. Educational Evaluation and Policy Analysis, 37(4), 501-519. https://www.jstor.org/stable/43773524; Hillman, N. W., Fryar, A. H., & Crespín-Trujillo, V. (2018). Evaluating the impact of performance funding in Ohio and Tennessee. American Educational Research Journal, 55(1), 144-170. https://doi.org/10.3102/0002831217732951; Shin, J. C. (2010). Impacts of performance-based accountability on institutional performance in the U.S. Higher Education, 60(1), 47–68.; Shin, J. C., & Milton, S. (2004). The effects of performance budgeting and funding programs on graduation rate in public four-year colleges and universities. Education Policy Analysis Archives, 12, 1-22. https://doi.org/10.14507/epaa.v12n22.2004; Tandberg, D. A., & Hillman, N. W. (2014). State higher education performance funding: Data, outcomes, and policy implications. Journal of Education Finance, 39(3), 222-243. https://www.jstor.org/stable/23597610
- (Hagood, L. P. (2019). The financial benefits and burdens of performance funding in higher education. Educational Evaluation and Policy Analysis, 41(2), 189–213. https://doi.org/10.3102/0162373719837318; Hu, X., Ortagus, J. C., Voorhees, N., Rosinger, K., & Kelchen, R. (2022). Disparate impacts of performance funding research incentives on research expenditures and state appropriations. AERA Open, 8(1), 1-24. https://doi.org/10.1177/23328584211071109; Kelchen, R., & Stedrak, L. J. (2016). Does performance-based funding affect colleges’ financial priorities? Journal of Education Finance, 41(3), 302-321. https://www.jstor.org/stable/44162557
- Boland, W. C. (2020). Performance funding and Historically Black Colleges and Universities: An assessment of financial incentives and baccalaureate degree production. Educational Policy, 34(4), 644–673. https://doi.org/10.1177/0895904818802118; Jones, T., Jones, S., Elliott, K. C., Owens, L. R., Assalone, A. E., & Gándara, D. (2017). Outcomes based funding and race in higher education: Can equity be bought? Palgrave Macmillan.
- (Li, A. Y. (2019). The weight of the metric: Performance funding and the retention of historically underserved students. The Journal of Higher Education, 90(6), 965–991. https://doi.org/10.1080/00221546.2019.1602391; Umbricht, M. R., Fernandez, F., & Ortagus, J. C. (2017). An examination of the (un)intended consequences of performance funding in higher education. Educational Policy, 31(5), 643–673. https://doi.org/10.1177/0895904815614398
- Nisar, M. A. (2015). Higher education governance and performance based funding as an ecology of games. Higher Education, 69(2), 289–302. https://doi.org/10.1007/s10734-014-9775-4
- (Cheslock, J. J., & Kroc, R. (2012). Managing college enrollments. In R. Howard, B. Knight & G. McLaughlin (Eds.), The handbook for institutional researchers (pp. 221–236). Jossey-Bass.
- (e.g., Ortagus et al., 2020)
- Odden, A., R., Picus, L. O., & Goetz, M. E. (2010). A 50-state strategy to achieve school finance adequacy. Educational Policy, 24(4), 628-654. https://doi.org/10.1177/0895904809335107
- Candelaria, C. A. & Shores, K. A. (2019). Court-ordered finance reforms in the adequacy era: Heterogeneous causal effects and sensitivity. Education Finance and Policy, 14(1), 31-60. https://doi.org/10.1162/edfp_a_00236; Feng, B., Partridge, M., & Perez-Silva, R. (2019). Taking measure of Ohio’s adequacy gap in school funding. The Ohio State University, C. William Swank Program in Rural-Urban Policy. https://core.ac.uk/download/pdf/186334459.pdf
- Feng et al., 2019
- Candelaria & Shores, 2019.
- Douglas-Gabriel, D., & Wiggins, O. (2021, March 24). Hogan signs off on $577 million for Maryland’s historically Black colleges and universities. The Washington Post. https://www.washingtonpost.com/education/2021/03/24/maryland-hbcus-lawsuit-settlement/; Harris, A. (2021). The state must provide: Why America’s colleges have always been unequal—and how to set them right. HarperCollins; White, B. (2021, April 28). Maryland finalizes $577M settlement for HBCU federal lawsuit. Associated Press. https://apnews.com/article/larry-hogan-maryland-lawsuits-legislation-education-d9a76565b03653234200033bed7a5862
- Feng et al., 2019.
- Illinois Board of Higher Education, 2021.
- Bound, J., Lovenheim, M. F., & Turner, S. (2010). Why have college completion rates declined? An analysis of changing student preparation and collegiate resources. American Economic Journal: Applied Economics, 2(3), 129-57. https://www.jstor.org/stable/25760222 )
- Ibid.
- Webber, D. A., & Ehrenberg, R. G. (2010). Do expenditures other than instructional expenditures affect graduation and persistence rates in American higher education? Economics of Education Review, 29(6), 947-958. https://doi.org/10.1016/j.econedurev.2010.04.006
- Ibid.
- Deming & Walters, 2018.
- Webber & Ehrenberg, 2010.
- Hearn, 2015; Lingenfelter, 2008; McLendon et al., 2009.
- Trostel, P. A. (2012). The effect of public support on college attainment. Higher Education Studies, 2(4), 58–67. https://doi.org/10.5539/hes.v2n4p58; Johnson-Ahorlu, R. N., Alvarez, C. L., & Hurtado, S. (2013). Undermining the Master Plan: Divestment in Higher Education and Student Experiences. Journal of College Admission, 218, 22-35. https://files.eric.ed.gov/fulltext/EJ1011896.pdf
- Jenkins, D., & Belfield, C. (2014). Can community colleges continue to do more with less?. Change: The Magazine of Higher Learning, 46(3), 6-13. https://doi.org/10.1080/00091383.2014.905417; Webber, D. A. (2017). State divestment and tuition at public institutions. Economics of Education Review, 60, 1-4. https://doi.org/10.1016/j.econedurev.2017.07.007
- Brady, K., Eatman, T., & Parker, L. (2000). To have or not to have? A preliminary analysis of higher education funding disparities in the post-Ayers v. Fordice era: Evidence from critical race theory. Journal of Education Finance, 25(3), 297-322. https://www.jstor.org/stable/40704101; D’Amico, M. M., Katsinas, S. G., & Friedel, J. N. (2012). The new norm: Community colleges to deal with recessionary fallout. Community College Journal of Research and Practice, 36(8), 626-631. https://doi.org/10.1080/10668926.2012.676506; Marginson, S. (2011). Higher education and public good. Higher Education Quarterly, 65(4), 411–433. https://doi.org/10.1111/j.1468-2273.2011.00496.x
- State Higher Education Executive Officers Association. (2020). State Profile: Illinois. https://web.archive.org/web/20210617202755/https://shef.sheeo.org/state-profile/illinois/
- Goodman & Volz, 2020.; Hutchens, N. H., Fernandez, F., & Edmondson, M. L. (2021). Toward a consumer protection framework to protect students from predatory practices: A legal analysis of judicial opinions and state laws, regulations. State Higher Education Executive Officers Association. https://sheeo.org/wp-content/uploads/2021/08/Hutchens-et-al-Toward_-a_Consumer_Protection_Framework.pdf
- In Indiana, 9.4% of the population is Black, but 10.0% of four-year public college students are Black. In Kentucky, 8.1% of the population is Black, but 8.4% of the public four-year college students are Black.
- Illinois Board of Higher Education, 2021.
- Morris, L. M., Smith, S., Davis, J., & Null, D. B. (2016). The prevalence of food security and insecurity among Illinois university students. Journal of Nutrition Education and Behavior, 48(6), 376-382. https://doi.org/10.1016/j.jneb.2016.03.013
- Phillips, E., McDaniel, A., & Croft, A. (2018). Food insecurity and academic disruption among college students. Journal of Student Affairs Research and Practice, 55(4), 353-372. https://doi.org/10.1080/19496591.2018.1470003
- Fernandez, F., & Butcher, C. (2023). Persistence, retention, completion, and student success. In G. McClellan & J. Kiyama (Eds.), The handbook of student affairs administration (5th Edition) (pp. 265-282). Jossey-Bass.
- Webber & Ehrenberg, 2010.
- Chetty et al., 2020. p. 1567.
- Chetty et al., 2020; Ford, K. S., Rosinger, K. O., & Zhu, Q. (2021). Consolidation of class advantages in the wake of the Great Recession: University enrollments, educational opportunity and stratification. Research in Higher Education, 62(7), 915-941. https://doi.org/10.1007/s11162-021-09624-0
- Chetty et al., 2020.
- Ibid.
- Taylor & Cantwell, 2018, 2019.
- Mezza, A., Ringo, D., Sherlund, S., & Sommer, K. (2020). Student loans and homeownership. Journal of Labor Economics, 38(1), 215-260. https://doi.org/10.1086/704609; Millett, C. M. (2003). How undergraduate loan debt affects application and enrollment in graduate or first professional school. The Journal of Higher Education, 74(4), 386-427. https://doi.org/10.1080/00221546.2003.11780854; Rothstein, J., & Rouse, C. E. (2011). Constrained after college: Student loans and early-career occupational choices. Journal of Public Economics, 95(1-2), 149-163. https://doi.org/10.1016/j.jpubeco.2010.09.015; Houle, J. N., & Addo, F. R. (2019). Racial disparities in student debt and the reproduction of the fragile black middle class. Sociology of Race and Ethnicity, 5(4), 562-577. https://doi.org/10.1177/2332649218790989; Kakar, V., Daniels, G. E., & Petrovska, O. (2019). Does student loan debt contribute to racial wealth gaps? A decomposition analysis. Journal of Consumer Affairs, 53(4), 1920–1947. https://doi.org/10.1111/joca.12271
- Baum, S., & O’Malley, M. (2003). College on credit: How borrowers perceive their education debt. Journal of Student Financial Aid, 33(3), 7–19. https://doi.org/10.55504/0884-9153.1068; Jackson, B. A., & Reynolds, J. R. (2013). The price of opportunity: Race, student loan debt, and college achievement. Sociological Inquiry, 83(3), 335–368. https://doi.org/10.1111/soin.12012; Kim, D. (2007). The effect of loans on students’ degree attainment: Differences by student and institutional characteristics. Harvard Educational Review, 77(1), 64–100. https://doi.org/10.17763/haer.77.1.n14t69l0q8292784; St. John, E. P. (2001). The impact of aid packages on educational choices: High tuition-high loan and educational opportunity. Journal of Student Financial Aid, 31(2), 35–54. https://doi.org/10.55504/0884-9153.1173
- Avery, C., & Turner, S. (2012). Student loans: Do college students borrow too much—or not enough? Journal of Economic Perspectives, 26(1), 165–192. https://doi.org/10.1257/jep.26.1.165; Wei, C. C., & Horn, L. (2013). Federal student loan debt burden of noncompleters (NCES 2013-155). National Center for Education Statistics. https://nces.ed.gov/pubs2013/2013155.pdf
- Looney & Yannelis, 2015.
- Chetty et al., 2020.
- Illinois Board of Higher Education, 2017; Prescott et al., 2021.
- Lumina Foundation, n.d.
- As an example for calculating headcount to FTE differentials, see https://files.eric.ed.gov/fulltext/ED579759.pdf
- Illinois Board of Higher Education, 2021.